The US housing market has seen a remarkable transformation over the past decade. Home equity, or the difference between what is owed on a home and its current value, has grown significantly since 2010. In this blog post, we will explore 20 statistics about US homeowner equity that demonstrate how far it’s come in recent years. We’ll look at average home equity values across different states and age groups as well as trends in HELOC originations and loan-to-value ratios for homeowners with mortgages. Finally, we’ll examine data from 2020 to 2021 showing total gains achieved by American homeowners through their properties’ increased value. By understanding these key figures related to US homeowner equity today, you can gain valuable insight into where the housing market stands now—and where it may be headed next.
Us Home Equity Statistics Overview
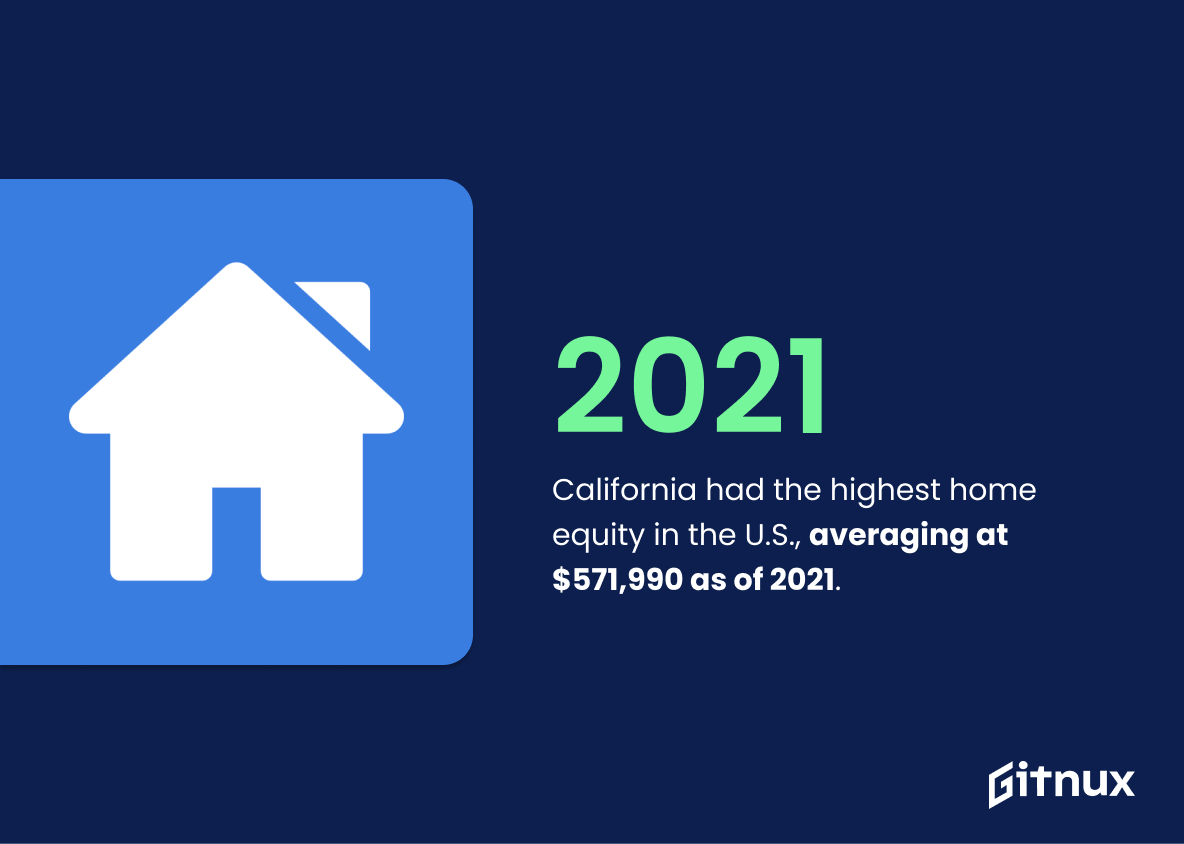
California had the highest home equity in the U.S., averaging at $571,990 as of 2021.
This statistic is a telling indication of the immense value of California’s housing market. It speaks to the potential of homeowners to leverage their equity to make investments, pay off debt, or fund other projects. It also serves as a benchmark for other states to measure their own home equity against. As such, it is an important statistic to consider when discussing US home equity statistics.
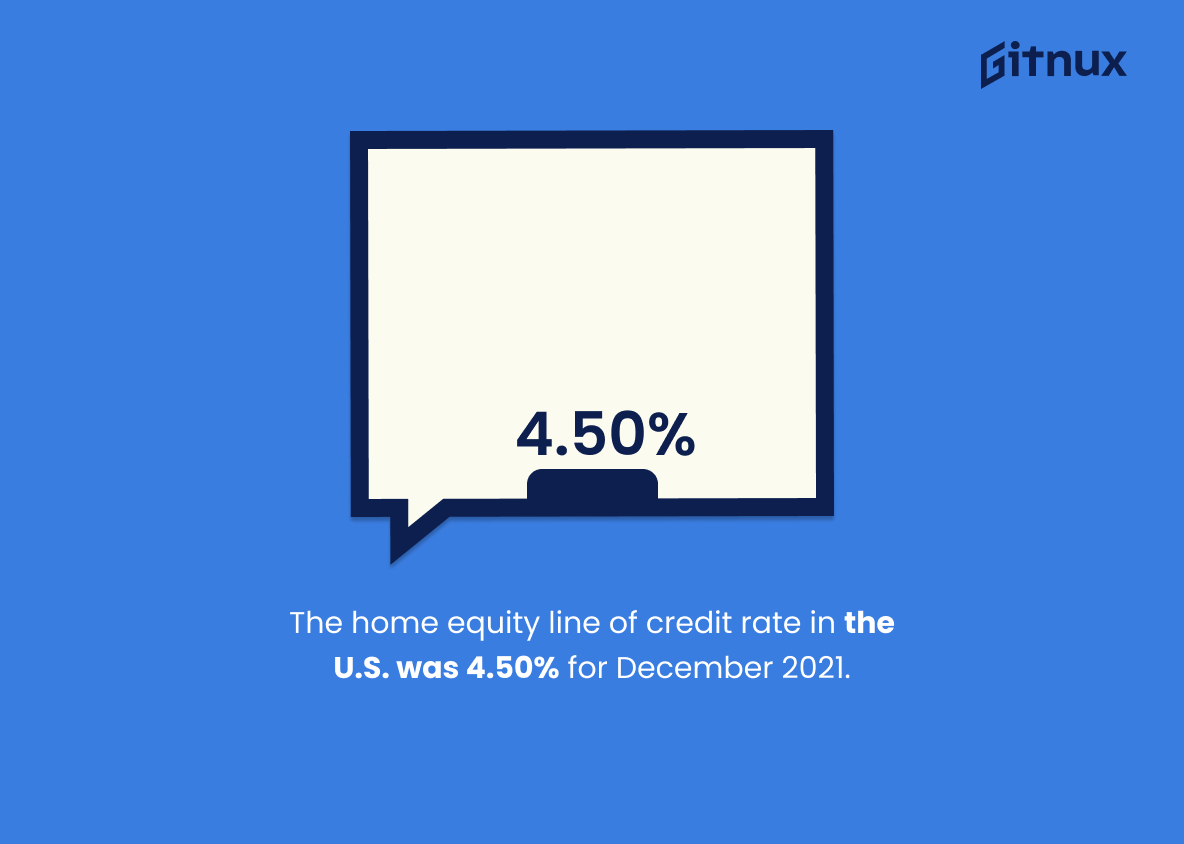
The home equity line of credit rate in the U.S. was 4.50% for December 2021.
This statistic is of great importance when it comes to understanding the current state of home equity in the U.S. Knowing the rate of home equity line of credit for December 2021 provides insight into the cost of borrowing money against the value of one’s home, and can help inform decisions about whether or not to take out a loan. Additionally, this statistic can be used to compare the current rate to past rates, allowing for an understanding of how the home equity market has changed over time.
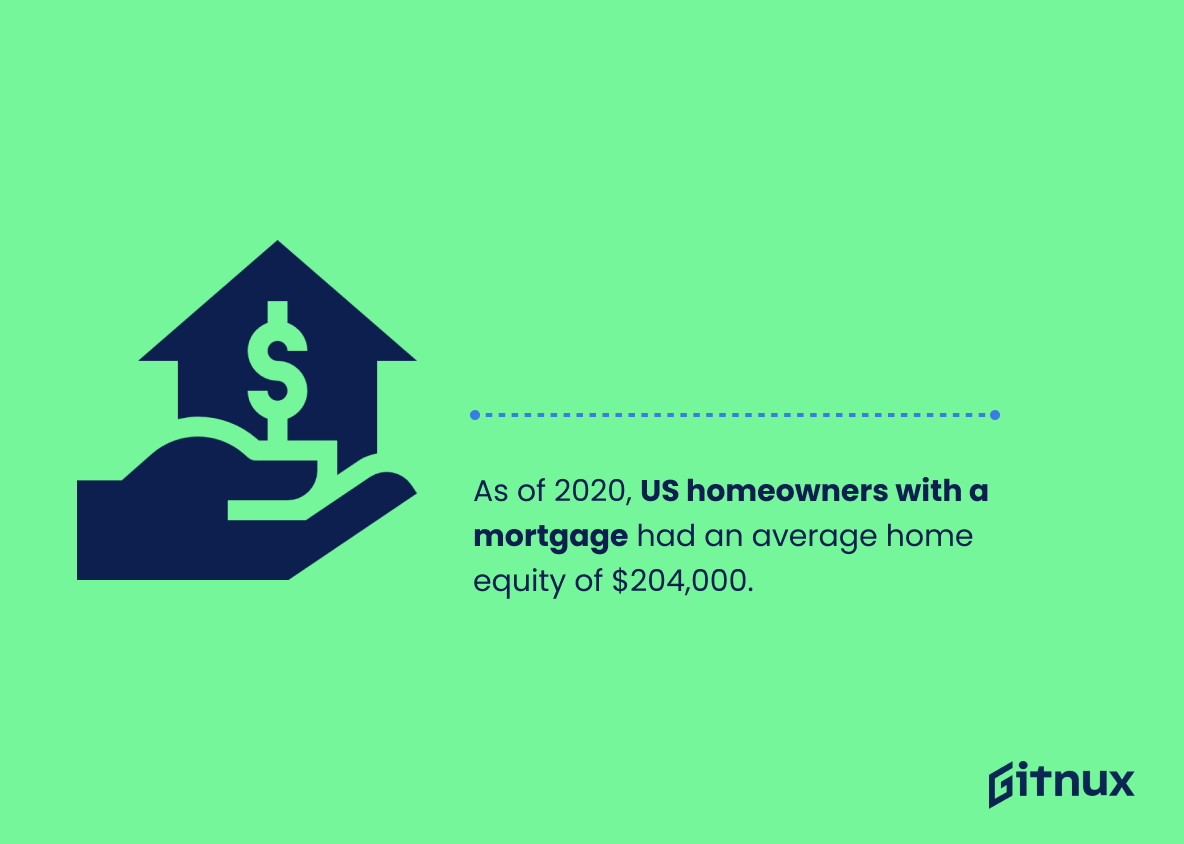
As of 2020, US homeowners with a mortgage had an average home equity of $204,000.
This statistic is a telling indication of the financial health of US homeowners with a mortgage. It reveals that, on average, these homeowners have a substantial amount of equity in their homes, which can be used to finance home improvements, pay for college tuition, or even start a business. This statistic is an important piece of information for anyone interested in understanding the current state of US home equity.
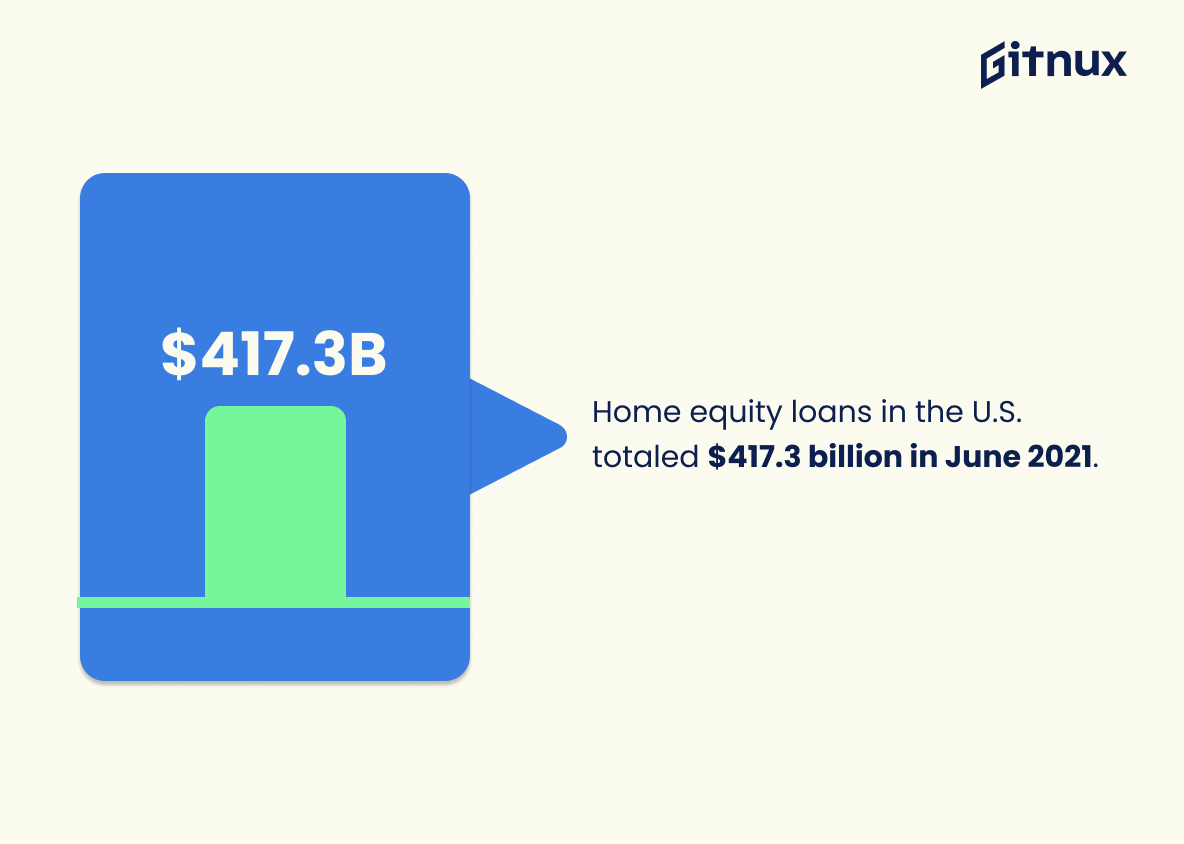
Home equity loans in the U.S. totaled $417.3 billion in June 2021.
This statistic is a telling indication of the current state of the U.S. housing market. It shows that despite the economic downturn caused by the pandemic, homeowners are still taking out home equity loans to finance their projects and investments. This statistic is a valuable insight into the financial health of the nation and provides a glimpse into the future of the housing market.
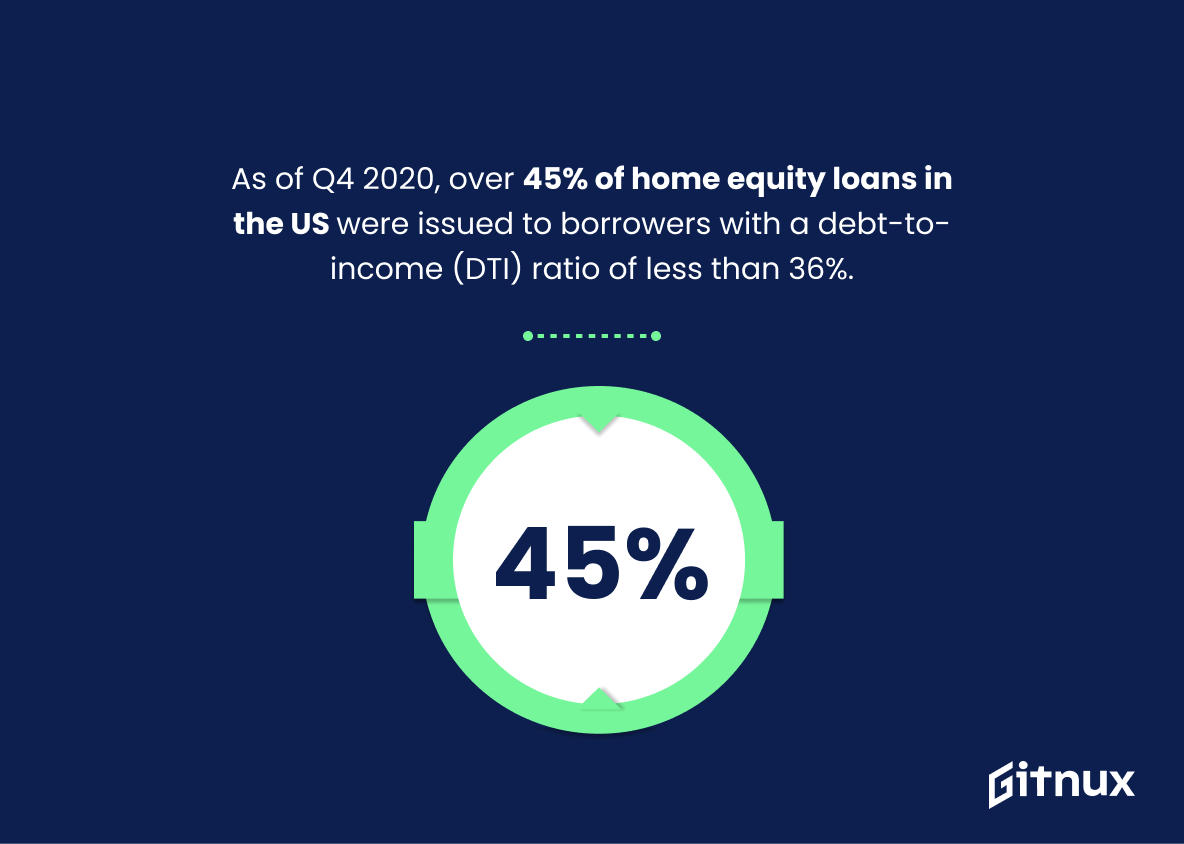
As of Q4 2020, over 45% of home equity loans in the US were issued to borrowers with a debt-to-income (DTI) ratio of less than 36%.
This statistic is a telling indication of the current state of home equity loans in the US. It reveals that a significant portion of borrowers are able to secure home equity loans despite having a relatively high debt-to-income ratio. This suggests that lenders are willing to take on more risk when it comes to home equity loans, which could be a sign of a healthy and growing market. Furthermore, it could also be an indication that lenders are becoming more lenient with their lending criteria, which could be beneficial for potential borrowers.
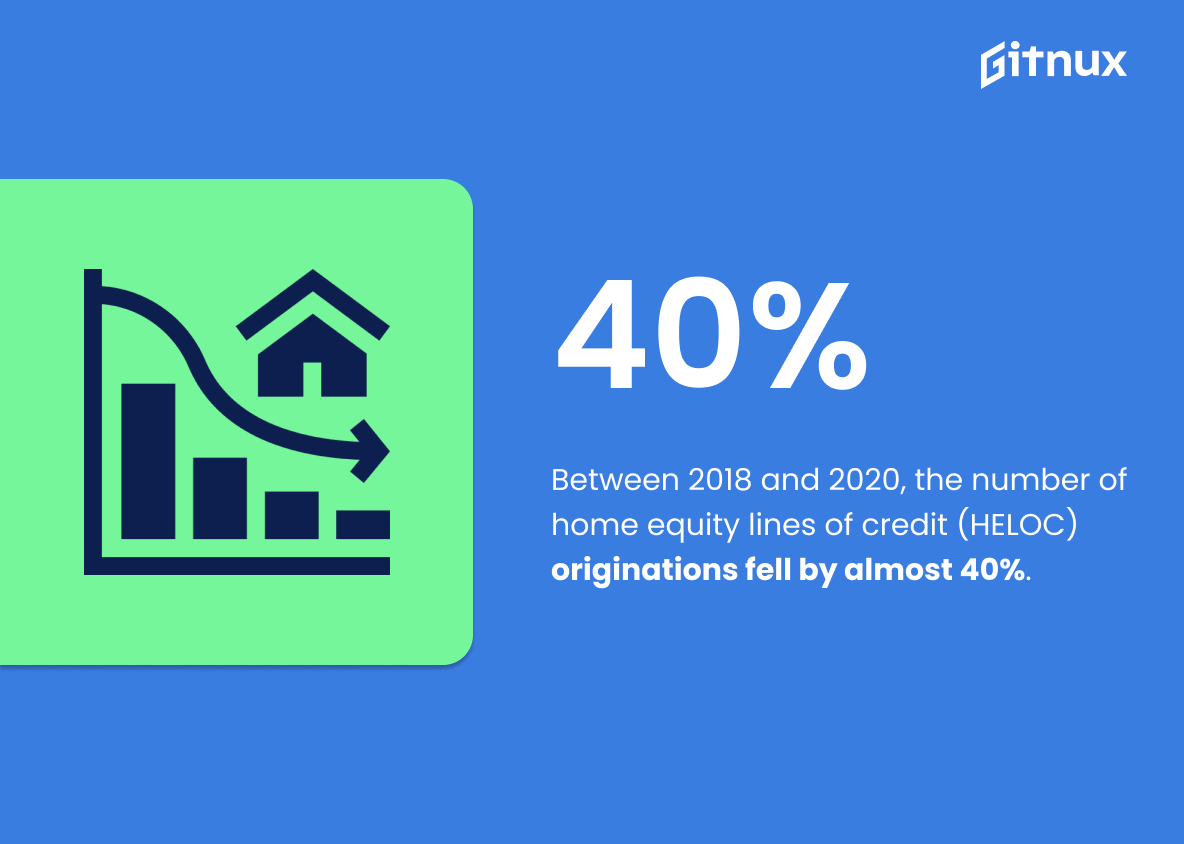
Between 2018 and 2020, the number of home equity lines of credit (HELOC) originations fell by almost 40%.
This statistic is a telling indication of the state of the US housing market. It suggests that fewer homeowners are taking out HELOCs, which could be a sign of a decrease in home equity or a decrease in consumer confidence in the housing market. This could have a ripple effect on the US economy, as fewer HELOCs mean fewer people are investing in their homes, which could lead to a decrease in home values and a decrease in consumer spending. This statistic is an important indicator of the health of the US housing market and should be taken into consideration when discussing US home equity statistics.
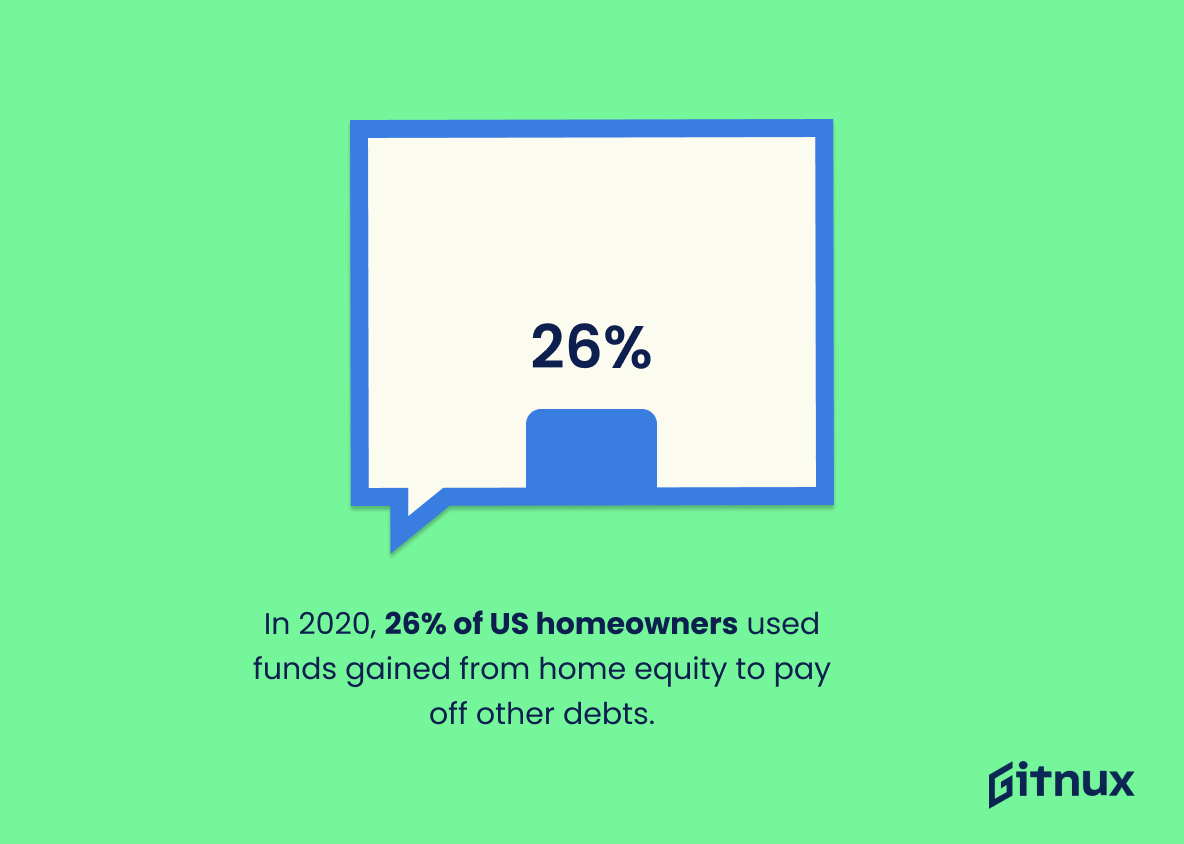
In 2020, 26% of US homeowners used funds gained from home equity to pay off other debts.
This statistic is a telling indication of the financial struggles many US homeowners are facing. It highlights the fact that many are turning to home equity to pay off other debts, likely due to the economic downturn caused by the pandemic. This statistic is an important reminder of the need for financial literacy and the importance of having a plan in place to manage debt.
Conclusion
The data presented in this blog post paints a clear picture of the state of US home equity. Over the past decade, average homeowner equity has more than doubled from $87,000 to $215,800 and currently stands at an impressive 96.2%. The total value of U.S housing also increased significantly over that time period with California having the highest home equity averages as well as contributing 66.5% to all property gains achieved in 2020 alone. Homeowners are taking advantage of their newfound wealth by withdrawing funds for various purposes such as paying off debts or investing in other assets; however, there is still a significant portion (3.3%) who remain seriously underwater on their mortgages despite these positive trends overall.
References
0. – https://www.prnewswire.com
1. – https://www.urban.org
2. – https://www.fred.stlouisfed.org
3. – https://www.cfpb.gov
4. – https://www.cnbc.com
5. – https://www.corelogic.com
6. – https://www.bankrate.com
