Entrepreneurship is an exciting and rewarding career path that can open up a world of possibilities. It requires hard work, dedication, and a lot of knowledge. Fortunately, there are many resources available to help you learn the ins and outs of starting and running a successful business. One of the most important aspects of entrepreneurship is understanding and utilizing statistics.
Statistics on entrepreneurship can provide valuable insight into how businesses succeed and fail, and can be used to make better decisions. In this article, we will explore the most valuable data, such as the main advantages of being an entrepreneur and the challenges you might face in the world of entrepreneurship. We will also take a look at the global picture overall, the main demographic characteristics of the entrepreneurs, and much more. We hope you will find our information useful.
Entrepreneurship: The Most Important Statistics
77% of entrepreneurs say they are happier since becoming business owners.
20% of businesses fail within their first two years, and 45% within five years.
General statistics on entrepreneurship
There are 582 million entrepreneurs in the world.
The majority (70%) of self-employed professionals are running their first business. 30% are serial entrepreneurs, self-employed professionals who have run more than 1 business. On average, serial entrepreneurs have run 3 businesses over their careers.
At the moment, there are more than 31 million entrepreneurs in the US. 55% of adult Americans have started at least one business in their lifetime.
Over the past 25 years, small businesses in the US have generated nearly 13 million net new jobs. And that is about two-thirds of the jobs added to the economy.
Entrepreneurs are 125% more successful if they’ve worked previous jobs in the industry they’re currently doing business in.
16% of current entrepreneurs have made a significant career pivot, working in a completely different field or industry than they did while employed.
20% of entrepreneurs own or manage a business with family members.
Studies show middle-aged men start the most successful businesses.
70% of US entrepreneurs expect to grow at least 25% in the next three to five years.
The number of unicorn startups (any startup that reaches a valuation of 1 billion USD) surpassed 1,000 during the first half of 2022, growing by 22% vs the previous year. In 2021, 959 private companies around the world achieved unicorn status.
The first year in business is the most difficult, according to two-thirds of entrepreneurs.
Failed entrepreneurs are more likely to be successful in their second attempt.
61% of entrepreneurs would be happy with their professional achievements if their career had ended today.
Every 12th American would like to become an entrepreneur. More and more people are willing to take the risk, so they could be their own bosses.
Statistics on entrepreneur demographics
50-year-old founders are 1.8x more likely to achieve upper-tail growth than 30-year-olds. Founders in their early 20s have the lowest likelihood of creating a successful business.
The average entrepreneur in the US starts their business when they are 42, but that age varies by industry. In the software industry, the average age is 40. In the oil and gas industry, it’s closer to 47.
Globally, there are 252 million women entrepreneurs.
Women now make up 40% of entrepreneurs, while men account for approximately 60%.
80% of female entrepreneurs handle their own tech needs, compared to 63% of male entrepreneurs. Men are nearly twice as likely to outsource it to a company, ask a friend, or seek out a web professional or designer for their website and technology needs.
Women of color run 50% of all women-owned businesses in the US.
Latino-owned businesses in the US employ more than 3 million people and grow the economy by almost 500 billion USD each year.
The most common ethnicity of entrepreneurs is White (67.1%), followed by Hispanic or Latino (15.4%), Asian (6.4%) and Black or African American (6.3%).
A college education is becoming less common among entrepreneurs in the US, according to LegalZoom. Roughly 56% of those who were self-employed in 2019 had a college degree, down from 60% in 2018 and 64% in 2017.
Research conducted by Zippia discovered that 62% of entrepreneurs have a Bachelor’s degree, while 11% hold a Master’s degree, and 6 have a High School Diploma.
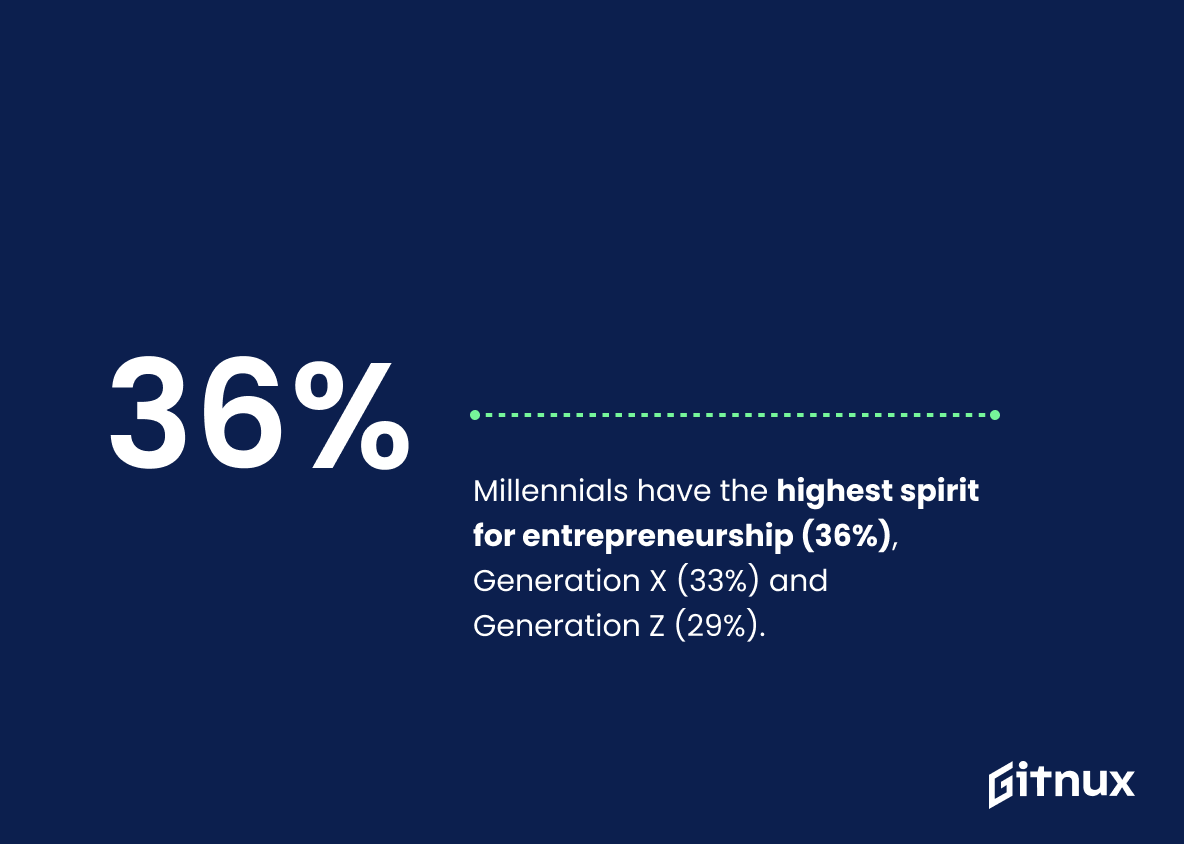
Millennials have the highest spirit for entrepreneurship (36%), followed by Generation X (33%) and Generation Z (29%), respectively.
According to OECD, women are under-represented in entrepreneurship. In 2018, women were about 60% as likely as men to be self-employed in the EU, and this gender gap starts young.
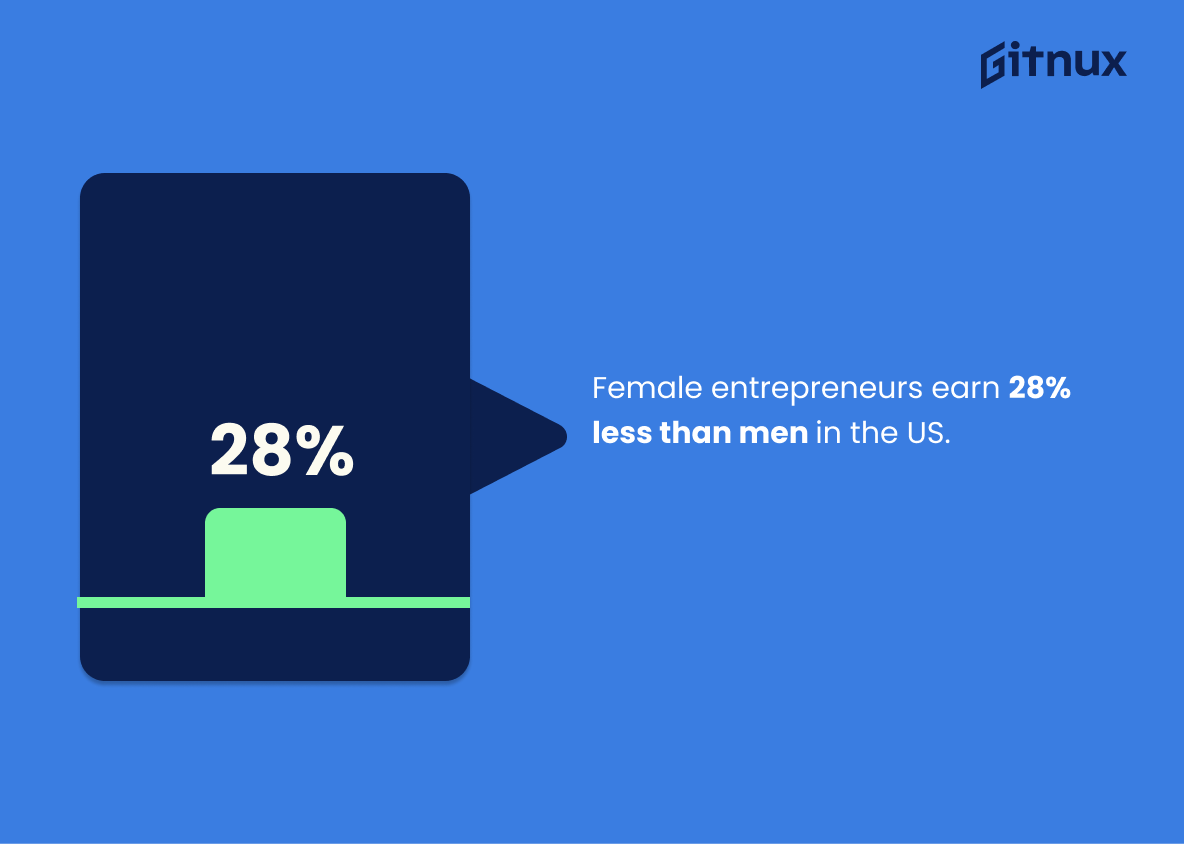
Female entrepreneurs earn 28% less than men in the US.
The top reasons for starting a business
Entrepreneurship brings happiness, according to GoDaddy survey. 77% say they are happier since becoming an entrepreneur.
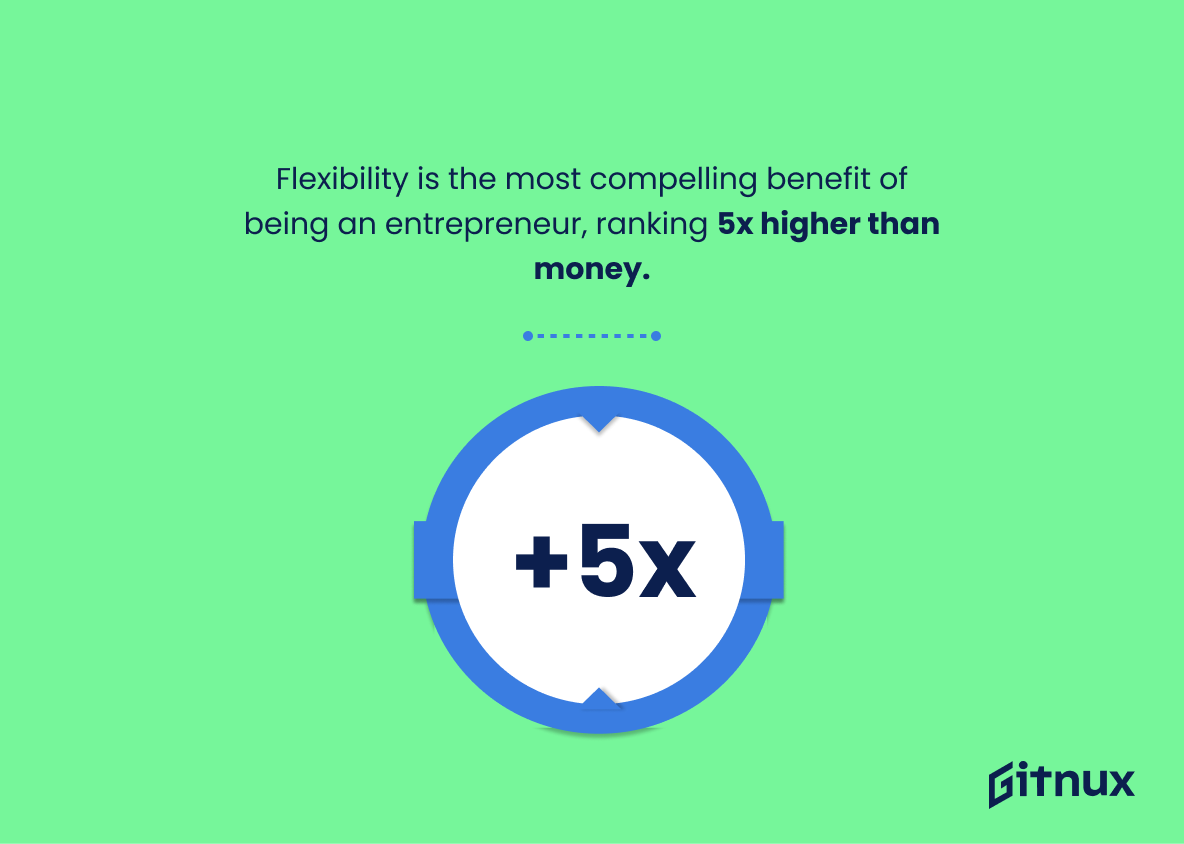
Flexibility is the most compelling benefit of being an entrepreneur, ranking 5x higher than the potential to earn more money, as stated by GoDaddy.
55% of entrepreneurs say their biggest motivation for starting their own business was the idea of being their own boss, while for 16% it was the idea to pursue their passion.
63% of Americans believe that entrepreneurship is a good career choice.
Check out our latest Freelance Statistics
17% of entrepreneurs start a business because of dissatisfaction with corporate life, 10% because they are not yet ready to retire, and 9% because of the inspiration for a new business.
How are entrepreneurs working differently compared to employed workers?
58% of business owners cite spending time with family in the evenings as crucial to their effectiveness, and 55% say it’s important to keep their weekends free for loved ones.
According to FreshBooks report, entrepreneurs manage their time differently. 58% agree that they work irregular or odd hours, and 41% work in shorter bursts of time. 39% of business owners work fewer hours but say they are more productive.
45% say they connect to their businesses from anywhere using mobile devices, which gives them more physical freedom. 29% of entrepreneurs report that they travel more, and 27% spend more time outdoors.
Career comfort zones are also getting affected by this different working approach, compared to traditional employment. According to 44% of entrepreneurs, they perform a much wider variety of tasks on a daily basis. 41% say they learn new things almost daily, and 35%of business owners agree that they take more risks.
A third of successful entrepreneurs say they have turned to a mentor or support group for advice about their company at some point (compared to 14% of respondents who ran businesses that had to close).
They prioritize investment in technology or strategic initiatives. Almost half (49%) of entrepreneurs spend finances on marketing campaigns (social media, advertising, PR). 58% use software to manage their finances.
While business owners aren’t willing to sacrifice their personal life, for most of them it’s still impossible to disconnect entirely. Just 28% say it’s vital to turn off their phones and laptops after business hours, according to Xero research.
Check out our latest Work-Life Balance Statistics
The main statistics on solopreneurship
According to US Small Business Administration, in 2019 50.7 million businesses were identified as small, employing up to 499 people. But, 81% of them were business owners with no additional employees.
With 41.8 million people that identify as a one-person company, numbers continue to rise as people battle to find real jobs and thus have to get creative. Solopreneurship in the US contributes over 1.3 trillion USD to its economy.
60.1% of small businesses are home-based, with sole proprietorships making up 73% of all businesses in the US.
53% of the entrepreneurs in Brazil operate on their own and don’t intend to hire any. With this number, Brazil is the world leader, leaving Madagascar a distant second with just 30% of solo operators.
Startup failure statistics and the reasons behind it
20% of businesses fail within their first two years, 45% within five years, and 65% fail within 10 years. Only 25% of businesses survive for more than 15 years.
The healthcare and social assistance industries do the best in terms of surviving, while the construction industry does the worst.
23% of businesses fail because they can’t put together the right team.
Not enough demand is cited as the main cause for a business to fail. The second and third most common reasons for a business to fail are problems with cash flow or capital (29%) and poor teamwork (29%).
The top reasons startups fail, according to Statista, are no market need (42%), finance shortage (29%), not finding the right team (23%), getting outcompeted (19%), and poor product (17%), among others.
Conclusion
In conclusion, entrepreneurship is a critical driving force behind economic growth and development. It is a key tool for creating jobs, generating wealth, and providing better opportunities for people and communities.
While the statistics on entrepreneurship can vary from country to country, the overall trend is positive and encouraging. Governments and organizations should continue to invest in and support entrepreneurs to ensure a bright future for the global economy.
FAQ
Resources
Embroker: “70+ Essential Entrepreneur Statistics in 2023”, cited February 2023. (Source)
Entrepreneur Media: “Solopreneurs are Changing the Face of the Economy”, cited February 2023. (Source)
Forbes: “Small Business Statistics Of 2023”, cited February 2023. (Source)
FreshBooks: “3rd Annual American Self-Employment Report – FreshBooks Research”, cited February 2023. (Source)
Fundz: “Solopreneur Startups on the Rise – The Numbers and Challenges”, cited February 2023. (Source)
GoDaddy: “New survey reports U.S. entrepreneurs optimistic about growth and technology”, cited February 2023. (Source)
LegalZoom: “86 key entrepreneur statistics for 2023”, cited February 2023. (Source)
NBER: “AGE AND HIGH-GROWTH ENTREPRENEURSHIP”, cited February 2023. (Source)
OECD: “Is the gender gap in entrepreneurship closing?”, cited February 2023. (Source)
Podia: “What’s a solopreneur and how are they different from an entrepreneur?”, cited February 2023. (Source)
SmallBizGenius: “39 Entrepreneur Statistics You Need to Know in 2023”, cited February 2023. (Source)
Statista: “Entrepreneurial spirit index in 2021, by generation”, cited February 2023. (Source)
Statista: “Number of unicorn startups worldwide from 2017 to 1st half 2022”, cited February 2023. (Source)
Statista: “The Top Reasons Startups Fail”, cited February 2023. (Source)
Tech.co: “Startup Failure Rates: Why So Many Fold and How to Save Yours”, cited February 2023. (Source)
ThinkImpact: “Entrepreneur Statistics”, cited February 2023. (Source)
U.S. Small Business Administration: “What’s New” Infographic Lets You See Answers To Top Small Business Questions”, cited February 2023. (Source)
Xero: “Make or Break?”, cited February 2023. (Source)
Zippia: “ENTREPRENEUR DEMOGRAPHICS AND STATISTICS IN THE US”, cited February 2023. (Source)
