Smartphones have become an integral part of our lives. We use them for everything from communication to entertainment, and they are constantly evolving to meet our needs. But have you ever wondered how much time we actually spend on our phones?
In this article, we will take a look at some of the latest smartphone usage statistics and explore how our usage of these devices has changed over time. We’ll also discuss the implications of these statistics and what they mean for our lives.
Smartphone Usage: The Most Important Statistics
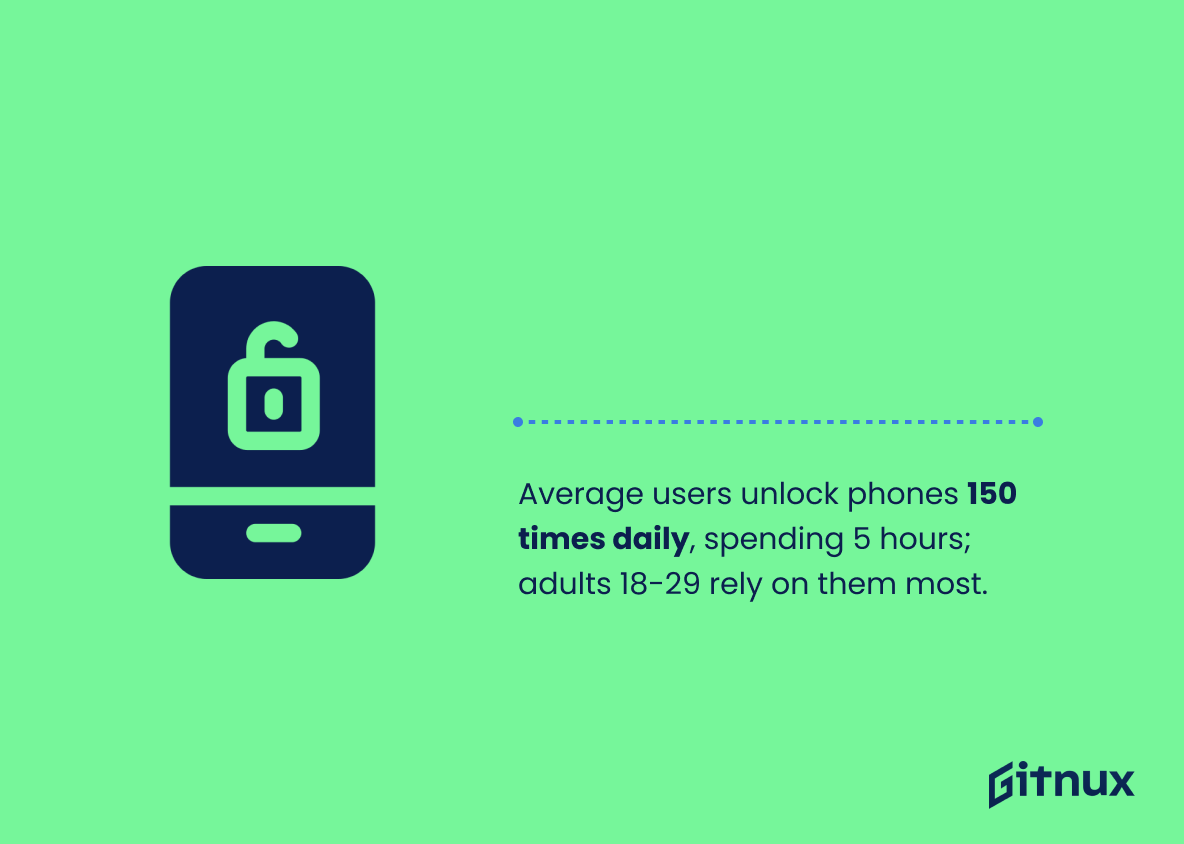
Smartphone usage is incredibly prevalent, with the average user unlocking their phone 150 times a day and spending at least 5 hours on it, and adults aged 18-29 being the most reliant on them.
66% of Americans show signs of nomophobia, 50% feel uneasy without their phone, and the average user clicks, taps, or swipes their phone 2,617 times a day, while 52% of teens sit in silence on their phones while hanging out with friends.
Smartphone Usage: Statistics Overview
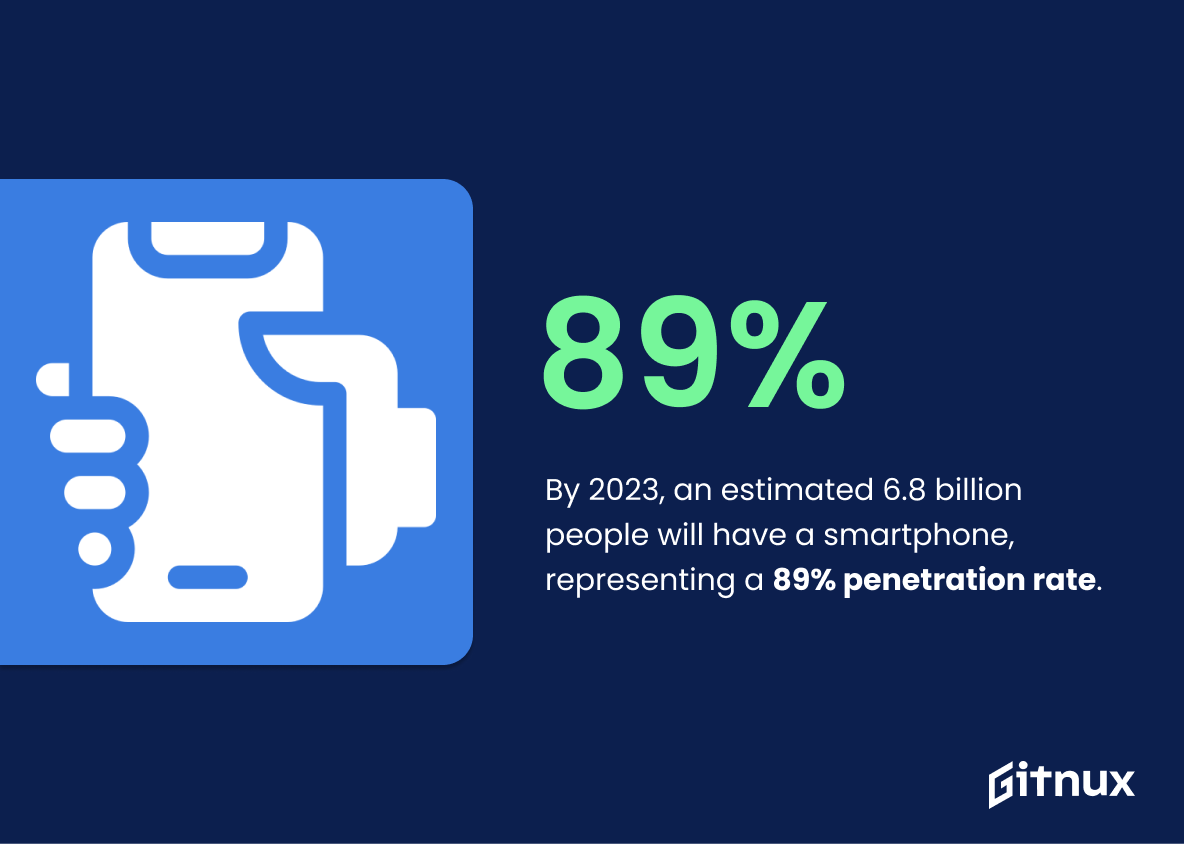
By 2023, an estimated 6.8 billion people will have a smartphone, representing a 89% penetration rate.
This shows the rapid growth of smartphone users over the past seven years, and the expected continued growth in the near future. This growth has implications for businesses, as it shows the importance of having a mobile-friendly presence in order to reach the majority of consumers.
In 2019, 1.52 billion smartphones were sold, with Samsung leading the market with 20% of the total market share. Additionally, 56% of website traffic was generated through mobile phones, and 66% of smartphone users are addicted to their phones.
This provides insight into the current state of the smartphone market, as well as the potential for growth in the future. Additionally, it highlights the prevalence of smartphone addiction and the impact of mobile phones on website traffic.
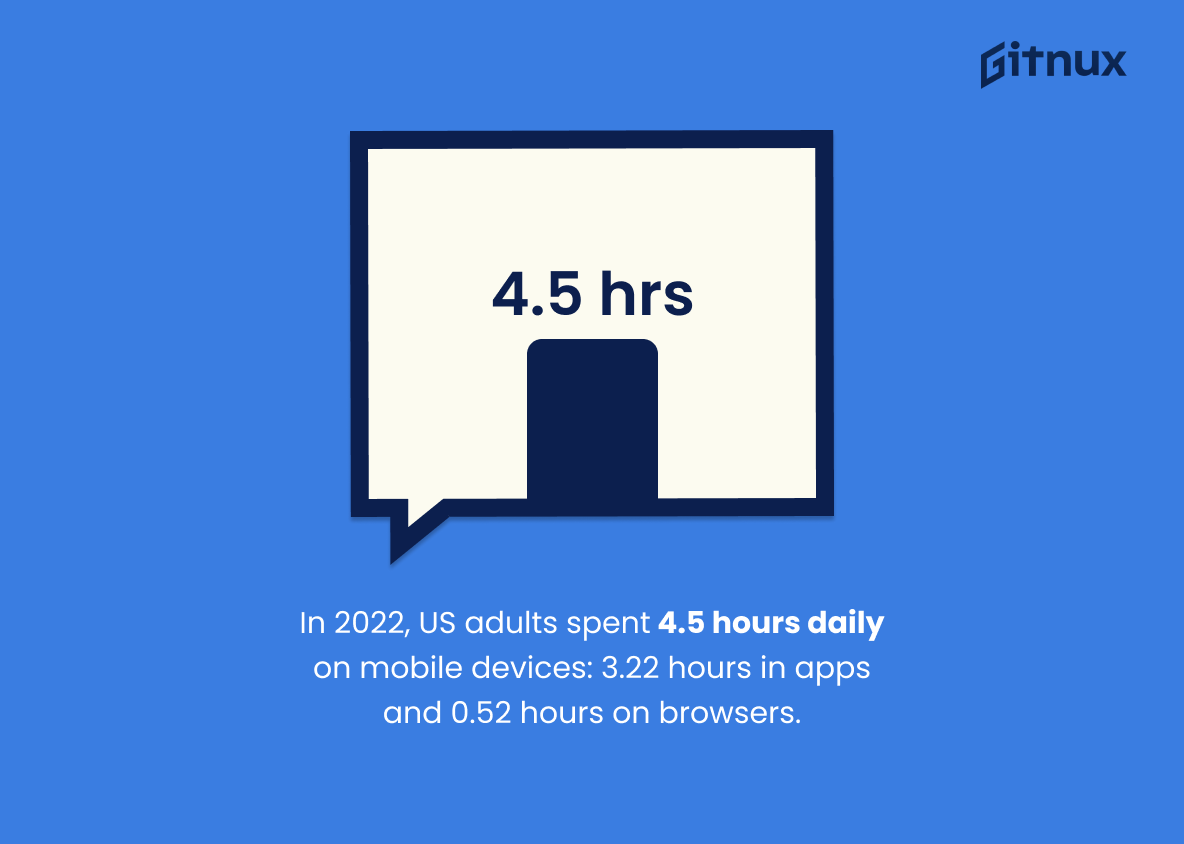
In 2022, US adults spent an average of 4:30 per day on mobile devices, with 3:22 of that time spent on mobile apps and 52 minutes spent on mobile browsers. This is an increase of 6 minutes from 2021 and is expected to increase by another 6 minutes in 2023.
Mobile devices, and particularly mobile apps, are becoming increasingly important as people spend more time on them than watching TV. This trend is expected to continue in the future, with smartphones continuing to widen their lead.
Smartphone usage is incredibly prevalent, with the average user unlocking their phone 150 times a day and spending at least 5 hours on it, and adults aged 18-29 being the most reliant on them.
This shows how much of an impact smartphones have on people’s lives, especially those living in households earning less than $30,000 a year who rely on their smartphones for internet access. It also demonstrates the importance of understanding smartphone usage in order to better understand how people interact with technology.
Millennials have the highest smartphone user base, followed by Gen X, Gen Z, and Baby Boomers, with 53% of children in the US having a smartphone by age 11 and college graduates having the largest share of smartphone owners.
This shows the prevalence of smartphone usage across different age groups and educational backgrounds. This data can be used to inform marketing strategies and product development decisions, as well as to understand how different demographics interact with technology.
The study shows that smartphone usage is widespread across all demographics in the United States, with 85% of White and Hispanic people, 83% of Black people, 85% of men and women, 89% of people in urban areas, 84% of people in suburban areas, and 80% of people in rural areas owning a smartphone.
This demonstrates the ubiquity of smartphone usage across different racial and socioeconomic backgrounds, and that even those in rural areas are not left behind in terms of access to technology.
71% of people spend more time on their phones than with their romantic partner, 44% of American adults admit to having anxiety when not having their phones, 72% of parents feel their teenagers are distracted by smartphones, and 51% of teenagers feel their parents are distracted by their phones.
Smartphone addiction has real-life consequences and can be a distraction in relationships, leading to anxiety and a lack of meaningful connections.
66% of Americans show signs of nomophobia, 50% feel uneasy without their phone, and the average user clicks, taps, or swipes their phone 2,617 times a day, while 52% of teens sit in silence on their phones while hanging out with friends.
This shows how reliant we have become on our phones and how it can lead to addiction.
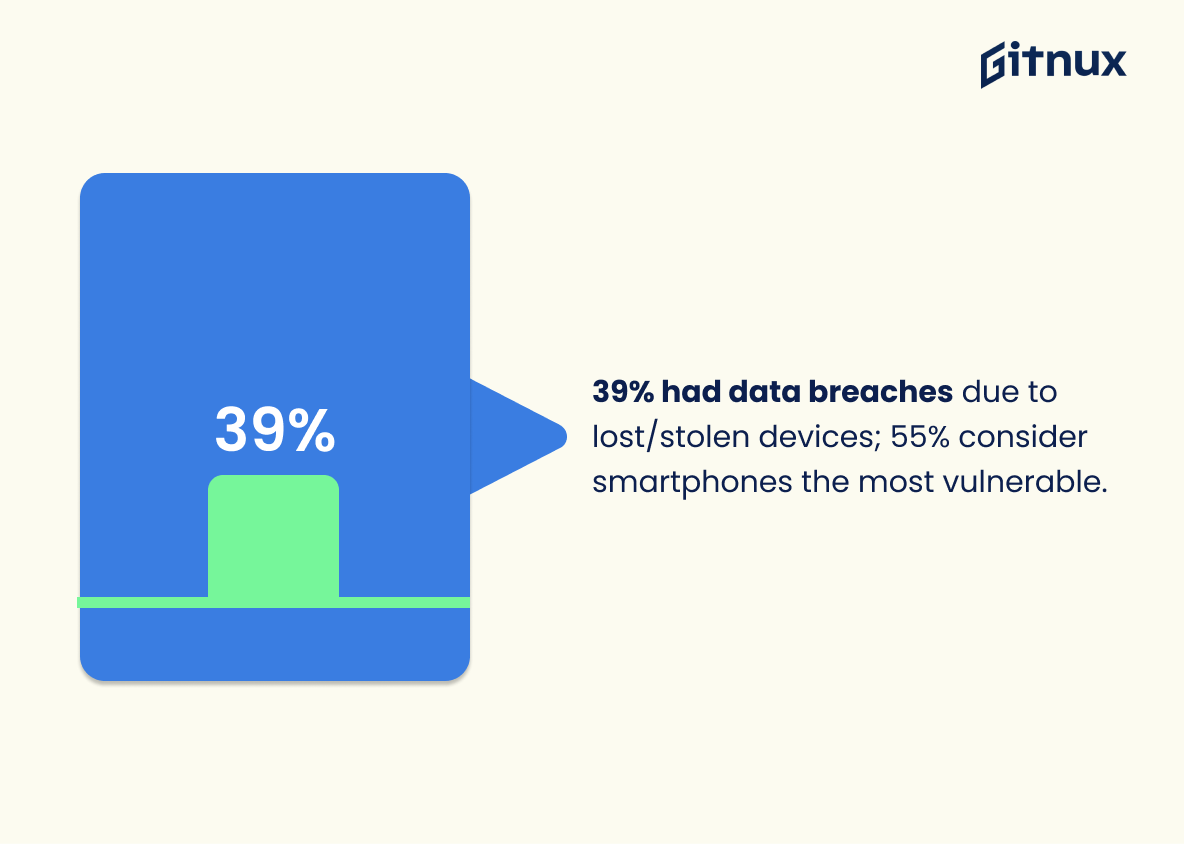
39% of surveyed organizations experienced a data security breach due to lost or stolen devices, while 55% of survey respondents say smartphones represent the most vulnerable endpoint at their organization.
This demonstrates the potential risks associated with the use of smartphones in the workplace, such as security concerns and potential distractions.
Despite the potential risks, employers admit that Smartphone use in the workplace increases productivity by 34%. Therefore, it is important to weigh the risks and benefits of allowing employees to use their smartphones for work.
66% of American employees use their cell phones at work several times a day, with an average of 8 hours per workweek spent on non-work-related activities, leading to a 23% increase in the likelihood of making a mistake in their work.
This shows the prevalence of cell phone usage in the workplace and the potential negative impacts it can have on employee productivity. It also highlights the potential benefits of allowing cell phone usage, such as strengthening relationships with coworkers and colleagues.
Supplementary Statistics
As of January 2021, the global mobile population amounted to 4.32 billion unique users.
This is a reminder of how deeply embedded these devices have become in our lives, and how much of an impact they have had on our daily routines. It is a powerful indicator of the potential of smartphones to shape our lives and the way we interact with the world around us.
In 2021, the estimated total number of smartphone users worldwide is 3.8 billion.
It serves as a reminder of the ubiquity of smartphones in our lives, and the potential reach of any business or organization that leverages this technology. It also highlights the importance of understanding the trends and behaviors of smartphone users in order to effectively engage with them.
In 2020, the worldwide smartphone penetration rate was 41.5%.
Almost half of the world’s population now owns a smartphone, making it an essential part of our daily lives. This statistic is especially relevant to a blog post about smartphone usage statistics, as it provides a baseline for understanding the scope of smartphone usage and its impact on our lives.
As of the fourth quarter of 2020, 76.12% of total time spent on the internet in the United States was through a mobile device.
This speaks to the fact that the majority of internet usage in the US is now conducted through smartphones, highlighting the importance of understanding the trends and behaviors associated with mobile device usage. This statistic is essential to consider when discussing smartphone usage statistics, as it provides a clear picture of the current state of the market.
In the United States, there were 276.17 million smartphone users in 2021.
A large portion of the population is using smartphones, which means that businesses and organizations need to be aware of the potential for mobile marketing and other strategies that take advantage of this technology. Additionally, it is important to note that this number is likely to continue to grow in the future, making it even more important for businesses to stay up to date with the latest trends in smartphone usage.
In 2021, the average smartphone user in the US spends 3 hours and 54 minutes per day on their smartphone.
The average US smartphone user is dedicating almost 4 hours of their day to their device, which is a significant amount of time. This statistic is important to consider when discussing smartphone usage statistics, as it provides insight into how much time people are spending on their phones.
As of 2019, 80% of smartphone users checked their phones within 1 hour of waking up.
For the majority of smartphone users, their device is the first thing they reach for when they wake up, demonstrating the level of reliance we have on our phones. This statistic is an important factor to consider when discussing smartphone usage statistics.
In 2020, 91% of youth in the US (18-29 years old) owned a smartphone.
Smartphones have become an integral part of the lives of the majority of young people in the US, and that they are increasingly relying on them for communication, entertainment, and other activities. This statistic is an important piece of information to consider when discussing smartphone usage statistics, as it provides insight into the prevalence of smartphone usage among young people.
96% of Facebook users accessed the platform via mobile phone in 2020.
The majority of users are now relying on their smartphones to stay connected to the social media platform, highlighting the importance of mobile devices in our lives. This statistic is especially relevant to a blog post about Smartphone Usage Statistics, as it provides a clear example of how smartphones are being used to access social media.
In 2019, the average adult in the US spent 38 minutes per day on Facebook on their mobile device.
On average, US adults are dedicating a significant portion of their day to using the social media platform on their phones. This is an important statistic to consider when discussing Smartphone Usage Statistics, as it demonstrates the impact that mobile devices have had on the way people interact with social media.
As of October 2020, the most popular mobile messaging app worldwide was WhatsApp, with roughly 2 billion monthly users.
This statistic is important to consider when discussing smartphone usage statistics, as it demonstrates the widespread use of the app and its influence on the mobile messaging market.
In 2021, mobile app downloads worldwide were estimated to reach 230 billion.
Smartphones have become an integral part of our daily lives, and that mobile apps are a major part of how we interact with the world around us. This statistic is a powerful reminder of the impact that smartphones have had on our lives, and how they have changed the way we communicate, shop, and entertain ourselves.
The average person in the US has 40 apps installed on their smartphone as of 2020.
The average person has embraced the convenience and utility of having a variety of apps at their fingertips. This statistic is a powerful reminder of how much our lives have been transformed by the smartphone revolution.
Mobile devices accounted for 61% of organic search engine visits in the US in the fourth quarter of 2020.
More and more people are relying on their smartphones to access the internet and search for information. This is an important insight for anyone looking to understand the current trends in smartphone usage and how it is impacting the way people search for information online.
Over 50% of smartphone users in the US have made a purchase on their device as of September 2021.
It highlights the importance of smartphones in the lives of Americans and the potential for businesses to reach customers through mobile devices. This statistic is a key indicator of the growing trend of mobile commerce and its potential to revolutionize the way people shop.
In 2021, the average smartphone user in the US is estimated to spend 94.85 minutes per day in mobile apps.
This is an important point to consider when discussing smartphone usage statistics, as it shows how mobile apps are becoming increasingly important in our lives.
As of June 2021, Samsung was the leading smartphone vendor globally, with a 17.7% market share.
It is a key indicator of the current state of the smartphone market and provides valuable insight into the trends and preferences of consumers. As such, it is an important piece of information to consider when discussing smartphone usage statistics.
The global revenue from mobile apps was estimated to be $581.9 billion in 2020.
The mobile app industry is booming, and that people are increasingly relying on their smartphones to access services and products. This is a clear indication that smartphones are becoming an integral part of our lives, and that the usage of mobile apps is only going to increase in the future.
In 2020, mobile gaming apps were the top app category by revenue, generating 72% of total app store spending.
This is indicative of the fact that smartphones are being used more and more for gaming purposes, and this trend is likely to continue in the future. This is an important point to consider when discussing smartphone usage statistics, as it shows that smartphones are becoming increasingly important for gaming.
Conclusion
Smartphone usage statistics show that smartphones are becoming an increasingly important part of our lives. With the rise of mobile technology, it is important to understand how we are using our devices and how they are affecting our lives.
Smartphone usage statistics can help us better understand the impact of smartphones on our lives and how we can use them to our advantage. With the right strategies, we can use our smartphones to improve our lives and make the most of the technology available to us.
References
1 – https://www.oberlo.com/statistics/how-many-people-have-smartphones#:~:text=The%20latest%20figures%20show%20an,2016%2C%20just%20seven%20years%20ago.
2 – https://techjury.net/blog/smartphone-usage-statistics/
3 – https://www.insiderintelligence.com/insights/mobile-users-smartphone-usage/
4 – https://www.zippia.com/advice/smartphone-usage-statistics/
5 – https://financesonline.com/smartphone-addiction-statistics/#:~:text=95%25%20of%20US%20teens%20have,Pew%20Research%20Center%2C%202019).
6 – https://www.zippia.com/advice/us-smartphone-industry-statistics/
7 – https://explodingtopics.com/blog/smartphone-addiction-stats
8 – https://www.slicktext.com/blog/2019/10/smartphone-addiction-statistics/
9 – https://blog.gitnux.com/smartphone-in-the-workplace-statistics/
10 – https://www.zippia.com/advice/cell-phones-at-work-statistics/#:~:text=Highly%20mobile%20employees%20spend%20an,to%20use%20their%20personal%20devices.
11 – https://www.pewinternet.org
12 – https://www.emarketer.com
13 – https://www.statista.com
14 – https://www.banking.com
ZipDo, cited June 2023: Smartphone Usage Statistics
