
In today’s competitive business environment, the role of the product manager is more important than ever. Responsible for leading the development, marketing, and overall success of products, these professionals juggle multiple responsibilities while keeping their finger on the pulse of market trends and customer needs. To ensure the effectiveness of their strategic decisions, product managers rely on a set of quantifiable metrics called key performance indicators (KPIs) to track progress and optimize their approach.
This blog post takes a deep dive into product manager KPIs, highlighting the most important metrics to monitor and how they can drive product success throughout the product lifecycle. Join us as we explore the importance of these KPIs and learn how to leverage them for better decision-making and increased profitability.
Product Manager KPIs You Should Know
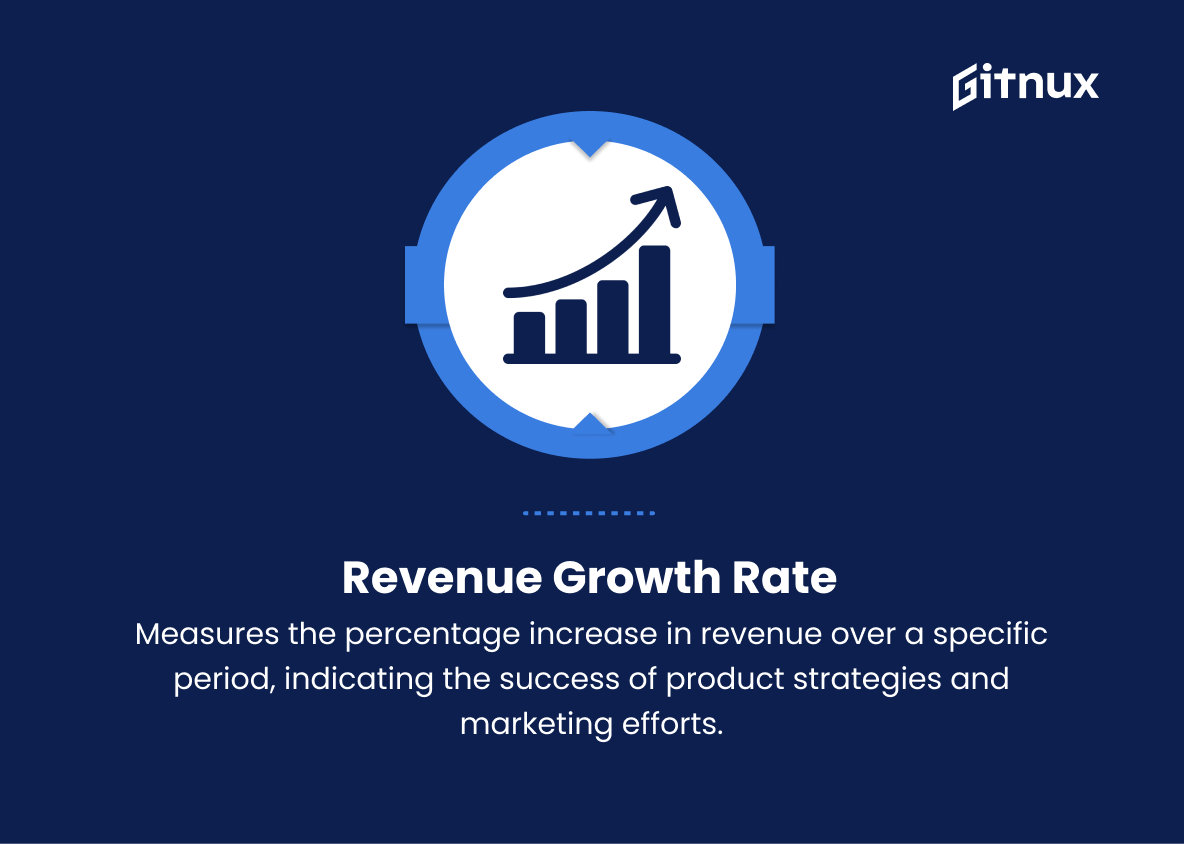
1. Revenue growth rate
Measures the percentage increase in revenue over a specific period, indicating the success of product strategies and marketing efforts.
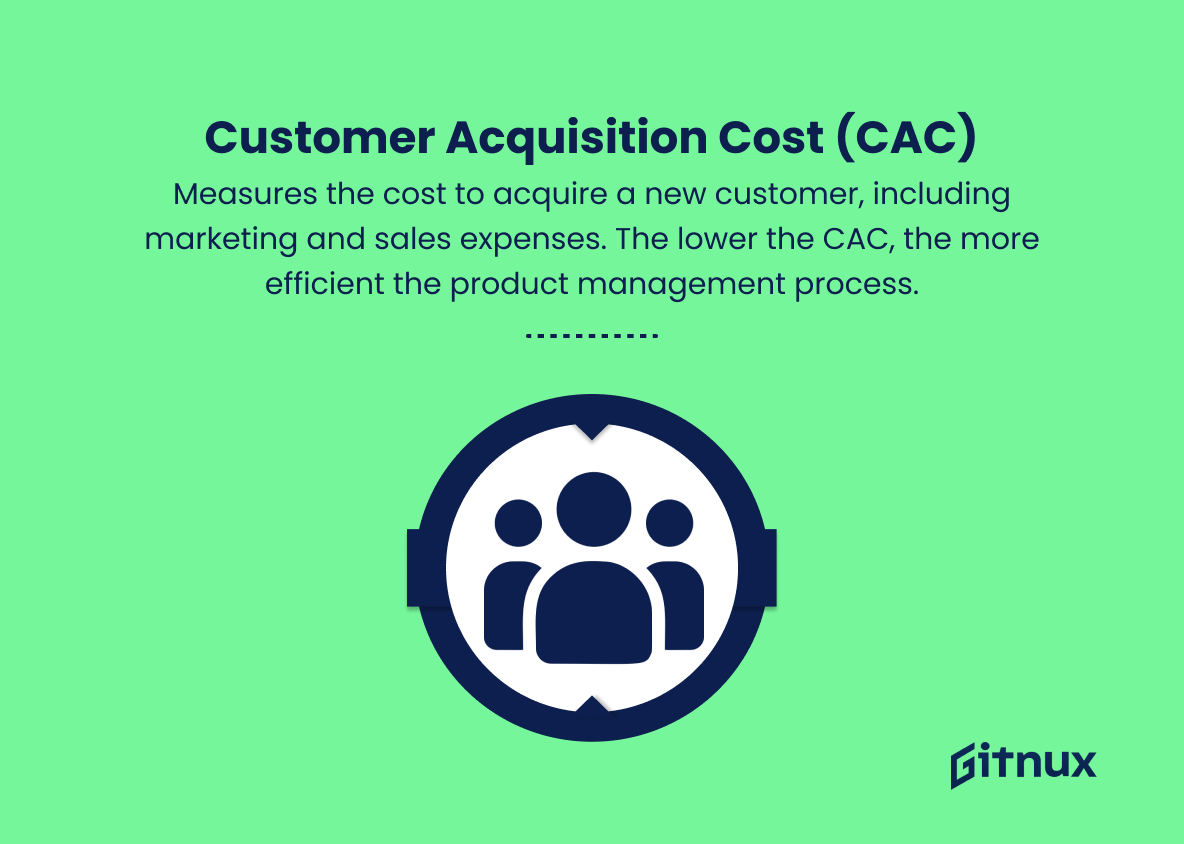
2. Customer Acquisition Cost (CAC)
Measures the cost to acquire a new customer, including marketing and sales expenses. The lower the CAC, the more efficient the product management process.
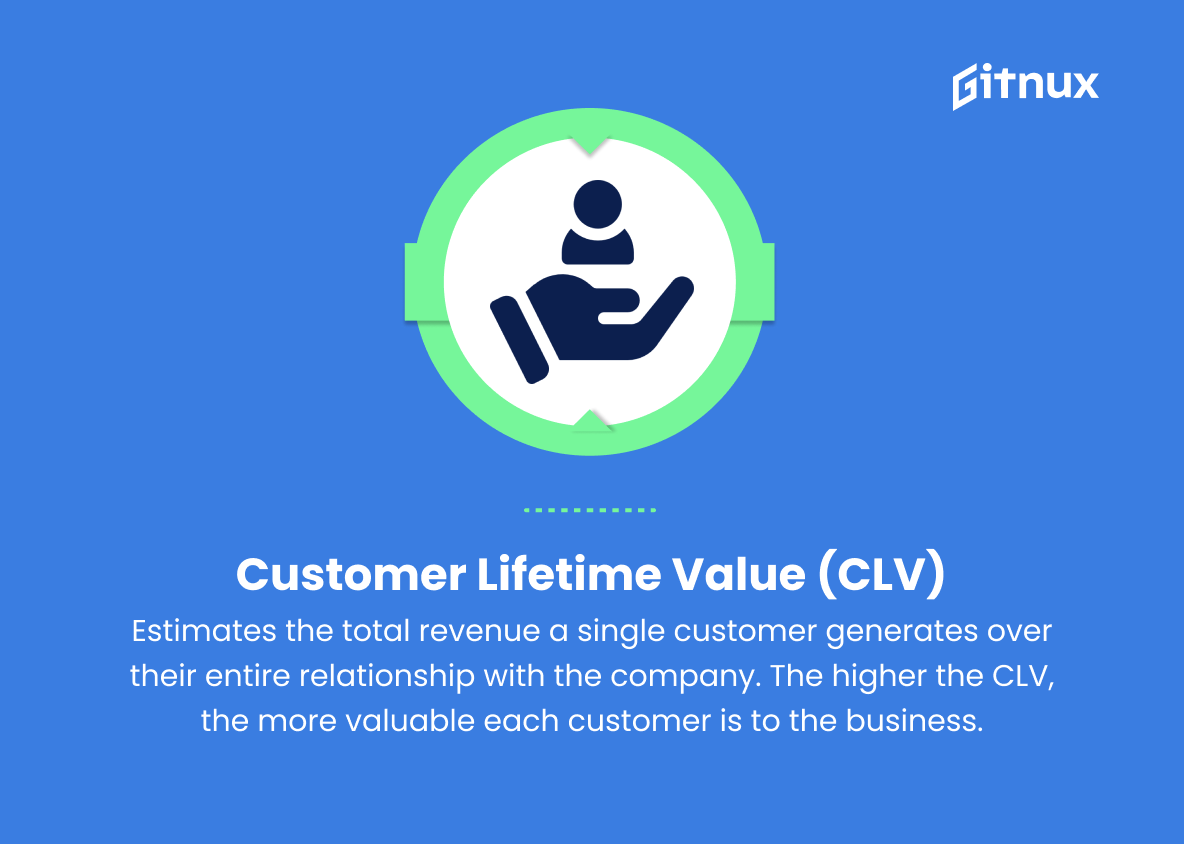
3. Customer Lifetime Value (CLV)
Estimates the total revenue a single customer generates over their entire relationship with the company. The higher the CLV, the more valuable each customer is to the business.
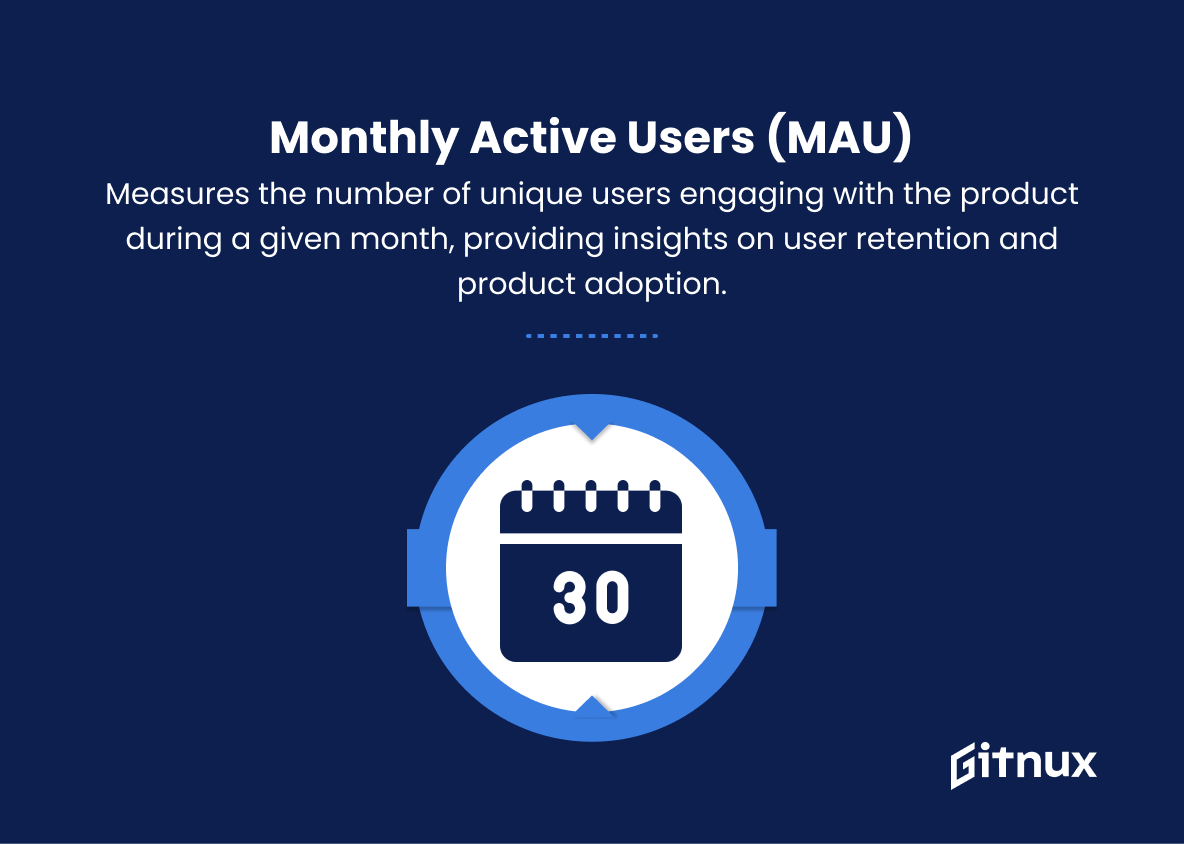
Each of the listed KPIs play a crucial role in assessing a product’s overall performance and success.4. Monthly Active Users (MAU)
Measures the number of unique users engaging with the product during a given month, providing insights on user retention and product adoption.
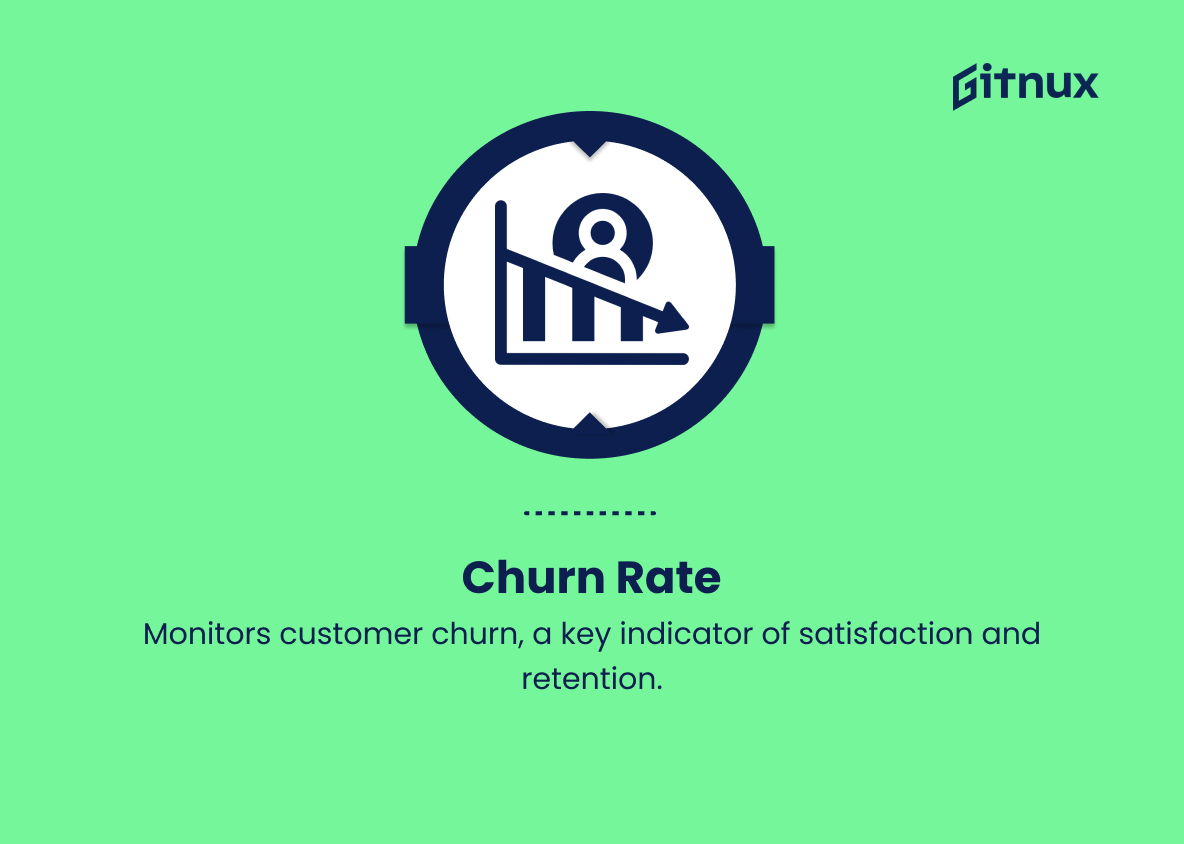
5. Churn Rate
Tracks the percentage of customers who cancel their subscription or stop using the product within a given timeframe. Lower churn rates indicate higher customer satisfaction and retention.
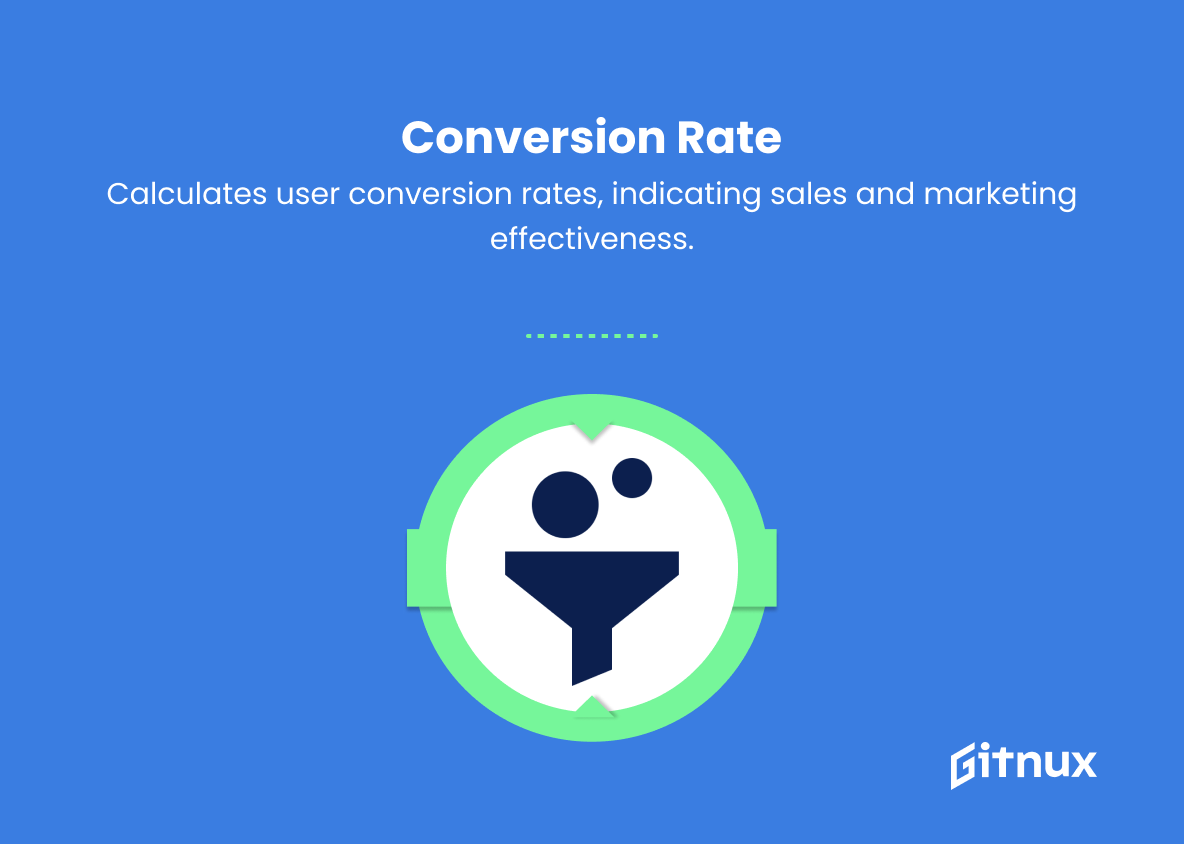
6. Conversion Rate
Measures the percentage of users who complete a desired action, such as purchasing the product or signing up for a service. Higher conversion rates indicate more effective sales and marketing strategies.
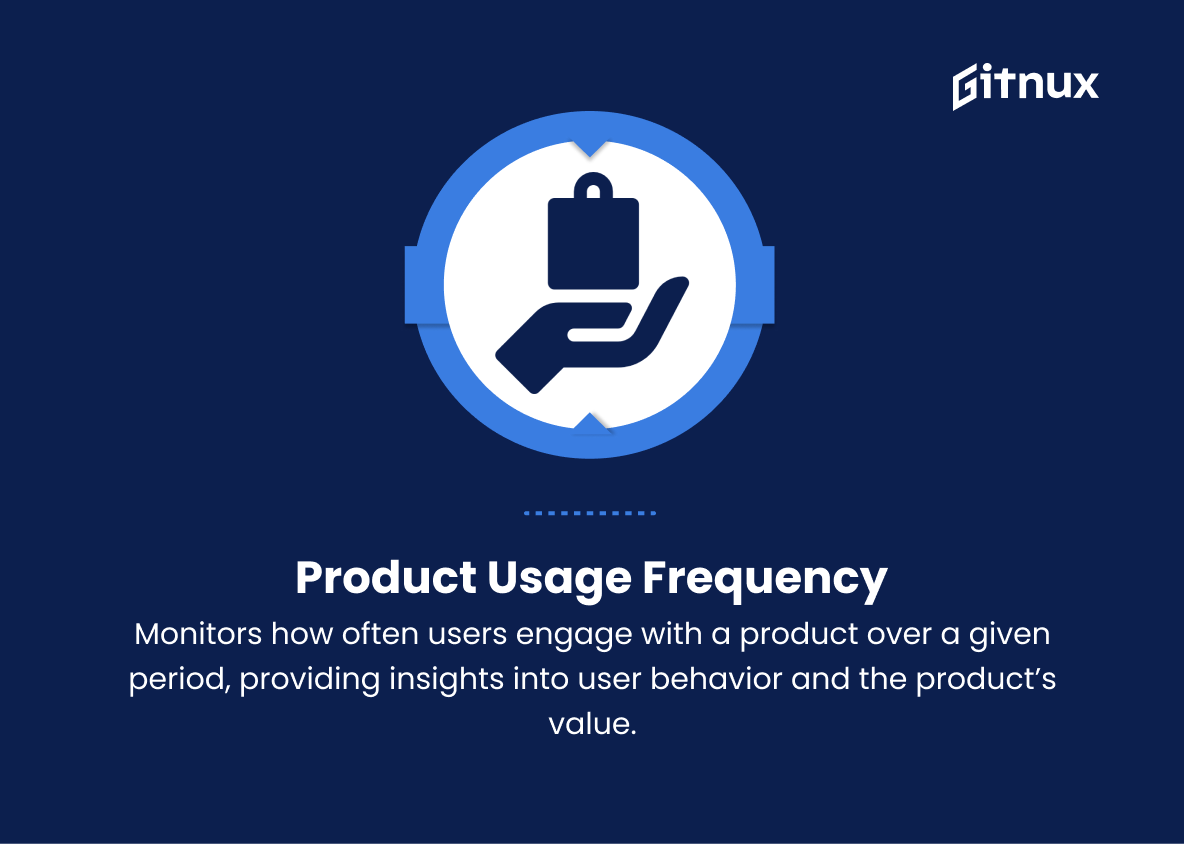
In today’s highly competitive business landscape, the role of a Product Manager is more critical than ever.7. Product Usage Frequency
Monitors how often users engage with a product over a given period, providing insights into user behavior and the product’s value.
8. Net Promoter Score (NPS)
Measures customer satisfaction and loyalty by gauging the likelihood they would recommend the product to others. Higher NPS scores indicate higher customer satisfaction and better product reputation.
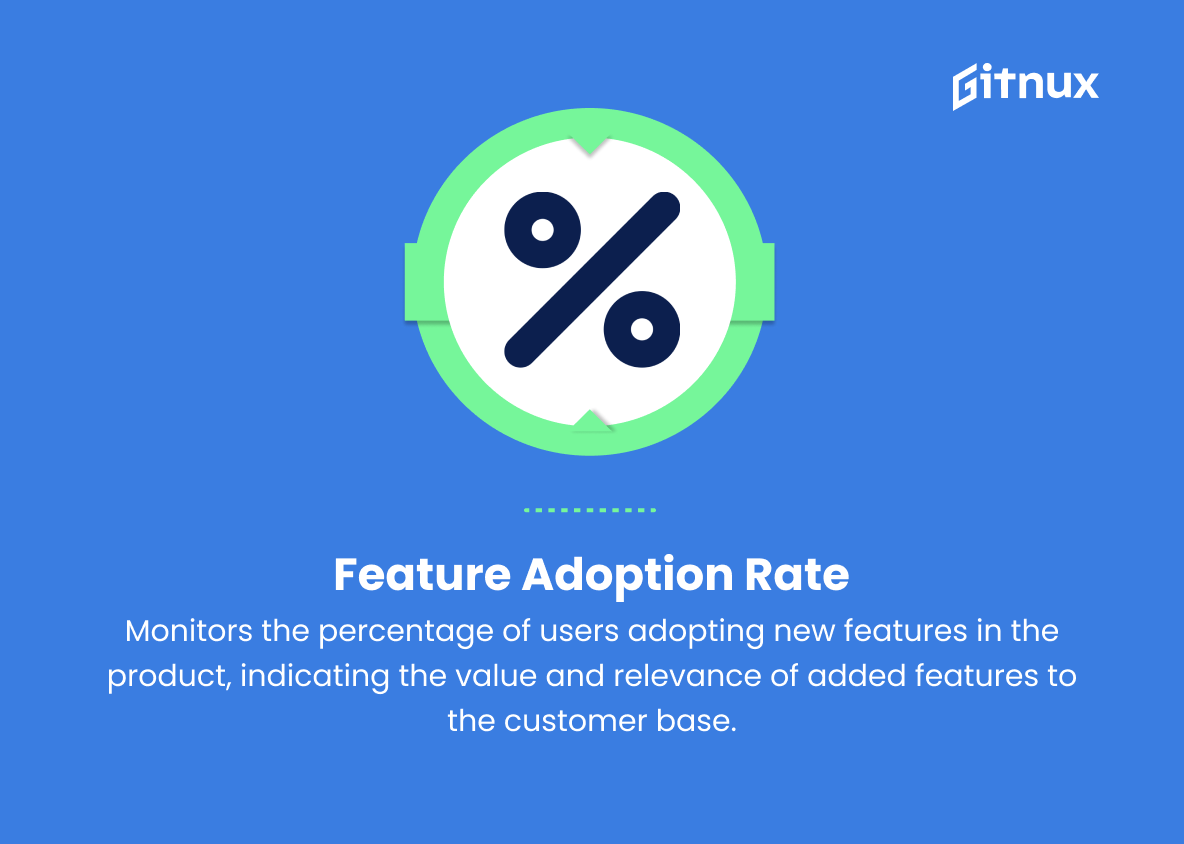
9. Feature Adoption Rate
Monitors the percentage of users adopting new features in the product, indicating the value and relevance of added features to the customer base.
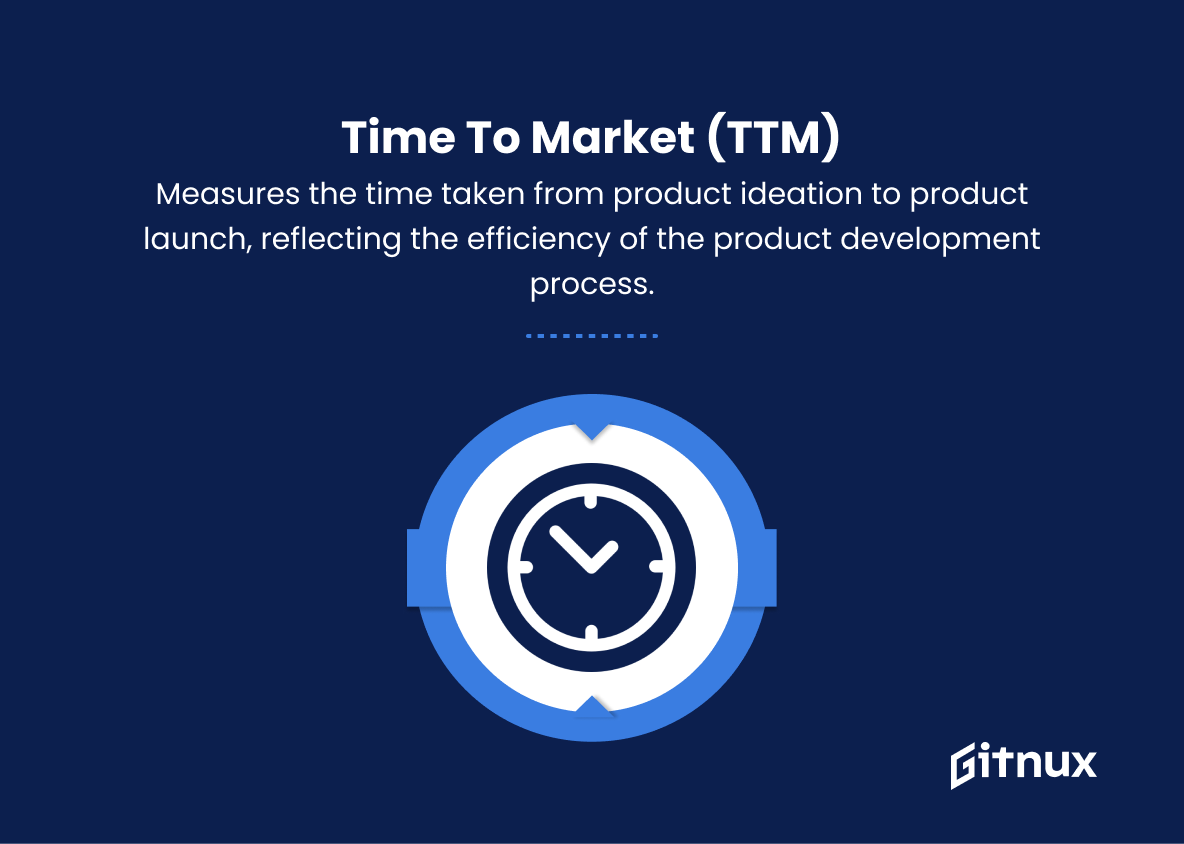
10. Time to Market (TTM)
Measures the time taken from product ideation to product launch, reflecting the efficiency of the product development process.
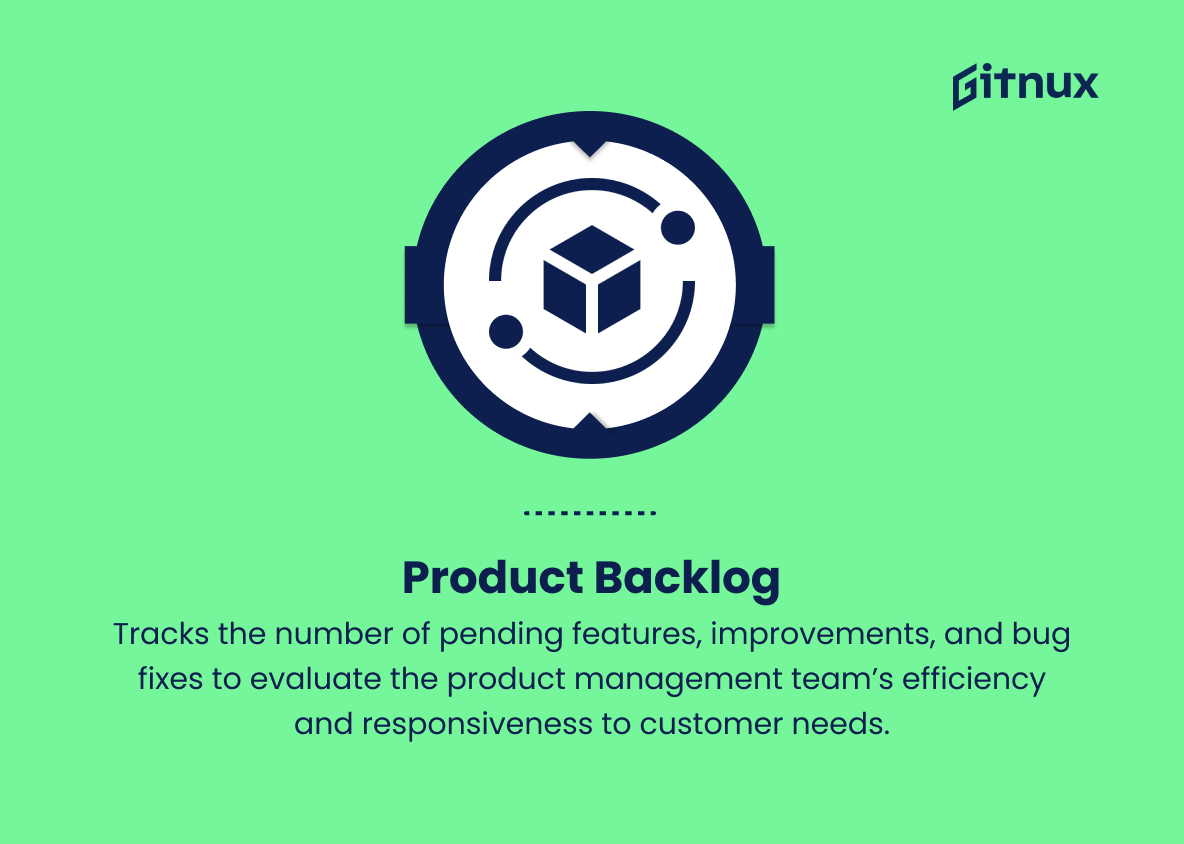
11. Product Backlog
Tracks the number of pending features, improvements, and bug fixes to evaluate the product management team’s efficiency and responsiveness to customer needs.
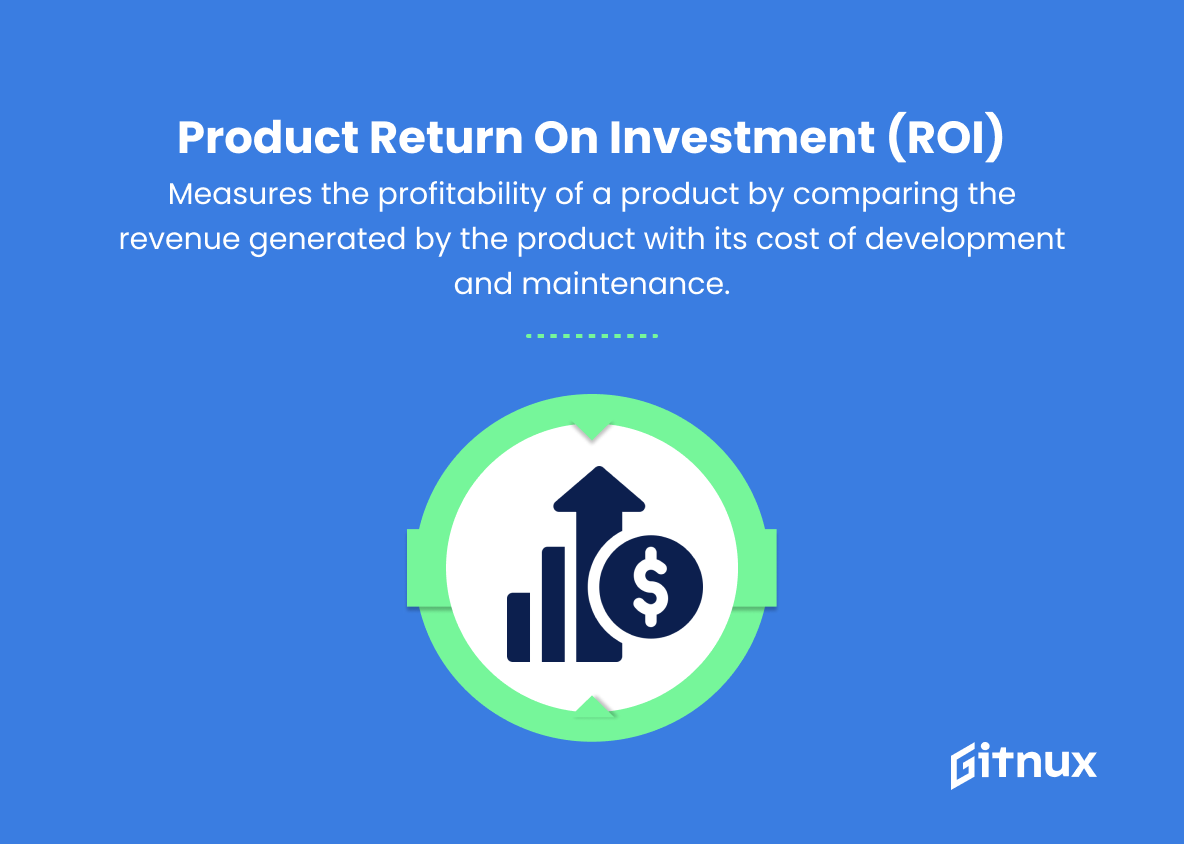
12. Product Return on Investment (ROI)
Measures the profitability of a product by comparing the revenue generated by the product with its cost of development and maintenance.
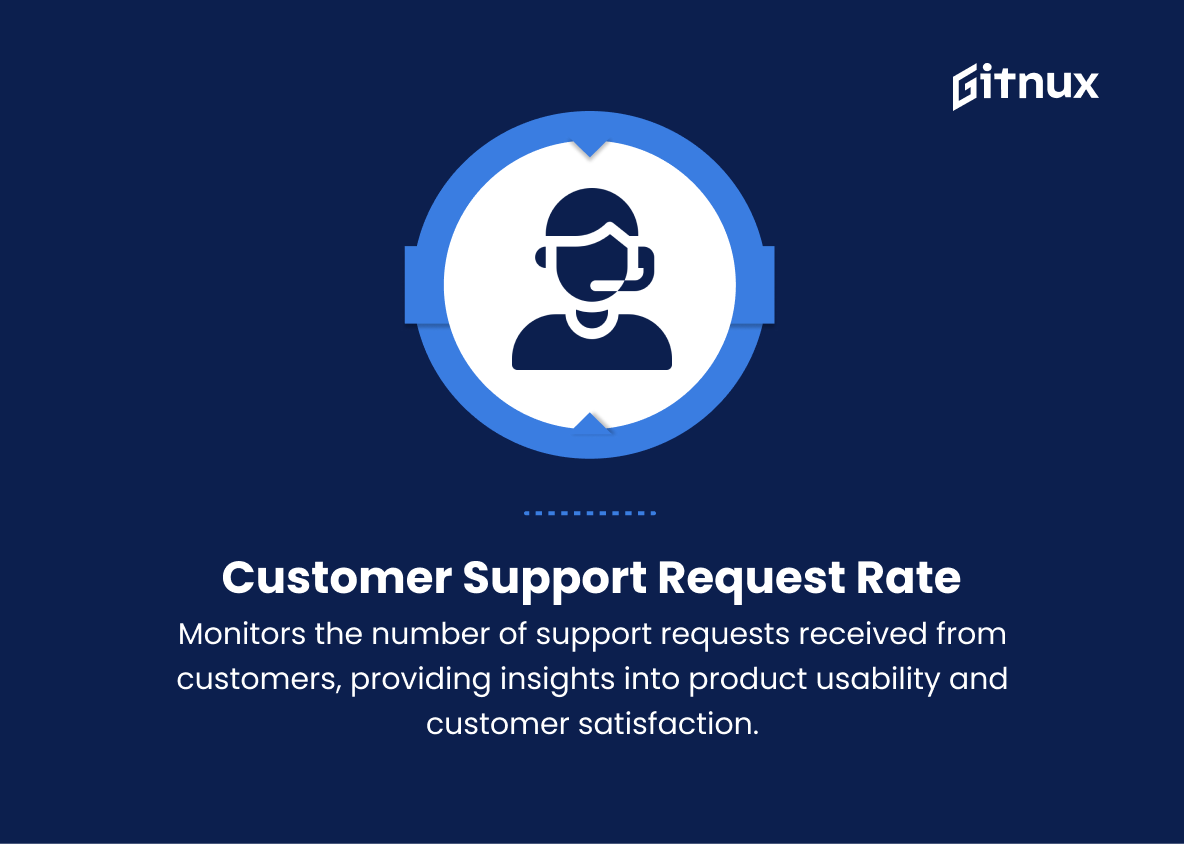
13. Customer Support Request Rate
Monitors the number of support requests received from customers, providing insights into product usability and customer satisfaction.
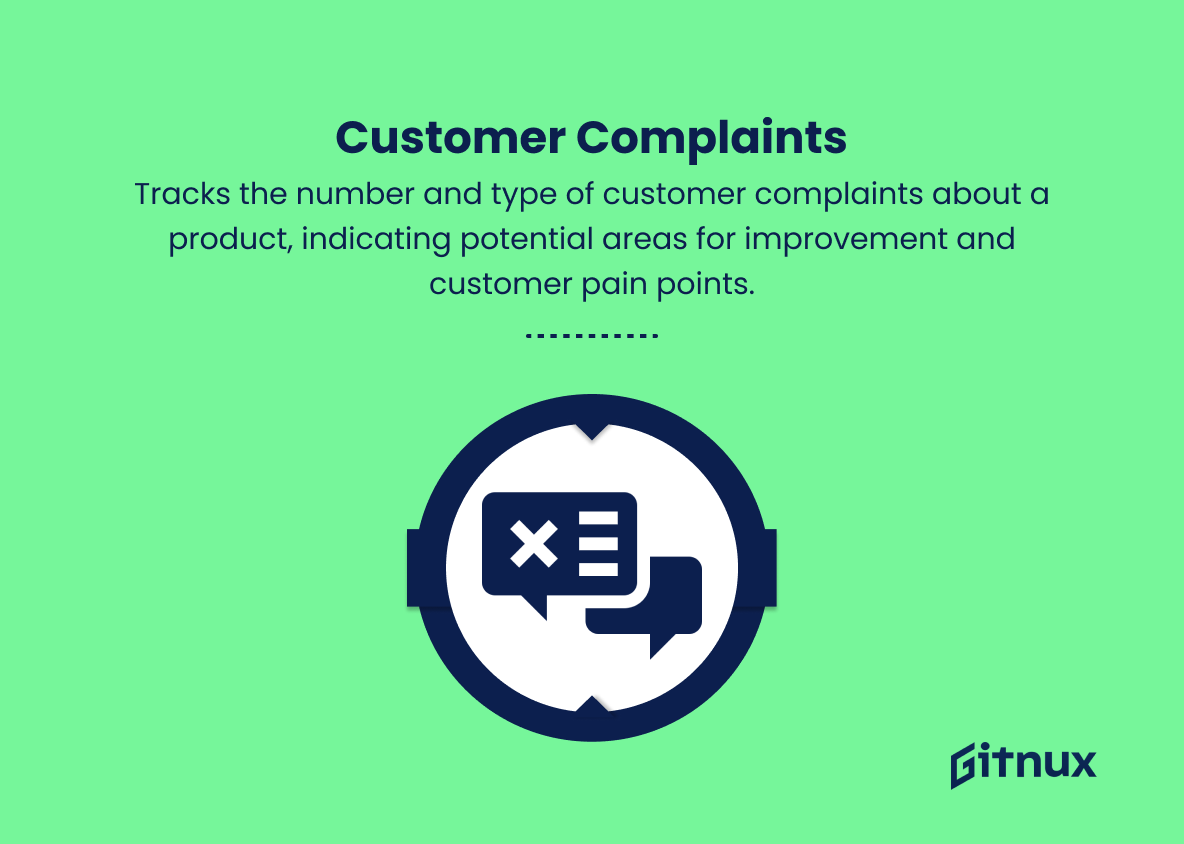
14. Customer Complaints
Tracks the number and type of customer complaints about a product, indicating potential areas for improvement and customer pain points.
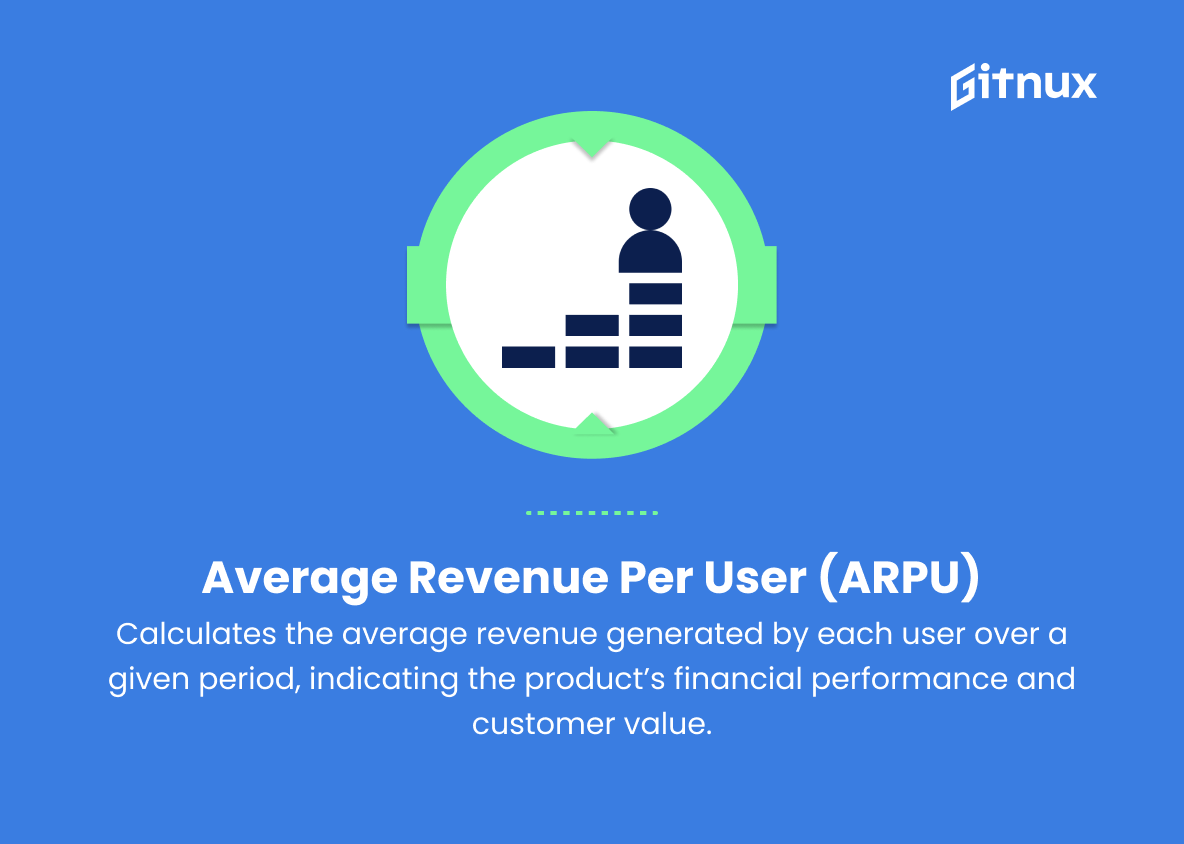
15. Average Revenue Per User (ARPU)
Calculates the average revenue generated by each user over a given period, indicating the product’s financial performance and customer value.
Product Manager KPIs Explained
Each of these KPIs plays a critical role in assessing the overall performance and success of a product. For example, revenue growth rate evaluates the effectiveness of product and marketing strategies, while customer acquisition cost reveals the efficiency of the product management process. Assessing customer lifetime value informs the organization of the potential revenue a single customer can generate, while monthly active users, churn rate, and conversion rate provide insight into user retention, adoption, and sales effectiveness.
In addition, product usage frequency and Net Promoter Score provide valuable information about user behavior and satisfaction, and feature adoption rate helps determine how valuable new features are to the audience. Time to market and product backlog show the efficiency of the product development process and responsiveness to customer needs. Product return on investment and average revenue per user further demonstrate the financial health of the product, and finally, tracking customer support requests and complaints identifies opportunities to improve usability and address customer pain points.
Conclusion
In summary, product manager KPIs are essential metrics that drive growth, efficiency, and success within an organization. By setting clear goals, continuously measuring performance, and analyzing results, product managers can optimize product development, user experience, and profit generation. As the competitive landscape continues to evolve, it is imperative to stay on top of industry trends and adapt KPIs accordingly.
Key metrics include user satisfaction, revenue growth, product adoption, and market share. When properly monitored and analyzed, these metrics provide invaluable insight into the strengths and weaknesses of a product or service offering, enabling product managers to make data-driven decisions that have the desired impact.
Embracing a culture of continuous improvement is critical to ensuring that organizations stay ahead of the curve and remain agile in the fast-paced world of technology and innovation. With robust KPIs in place, product managers can lead their teams to success and create products that delight customers and drive business growth.
.
