The mobile payment industry is growing at an incredible rate, with more and more people using their smartphones to make payments. This trend is expected to continue, as more businesses and consumers embrace the convenience and security of mobile payments.
In this blog post, we’ll take a look at some of the most interesting mobile payment statistics, and discuss what they mean for the future of the industry.
Mobile Payment: The Most Important Statistics
8 out of 10 respondents have used QR code payments at least once in 2021, double the amount from September 2020.
NFC payment is expected to triple in Europe between 2020 and 2024, but eventually be outperformed by Latin America.
Mobile Payment: Statistics Overview
Mobile Payment Statistics in different Countries
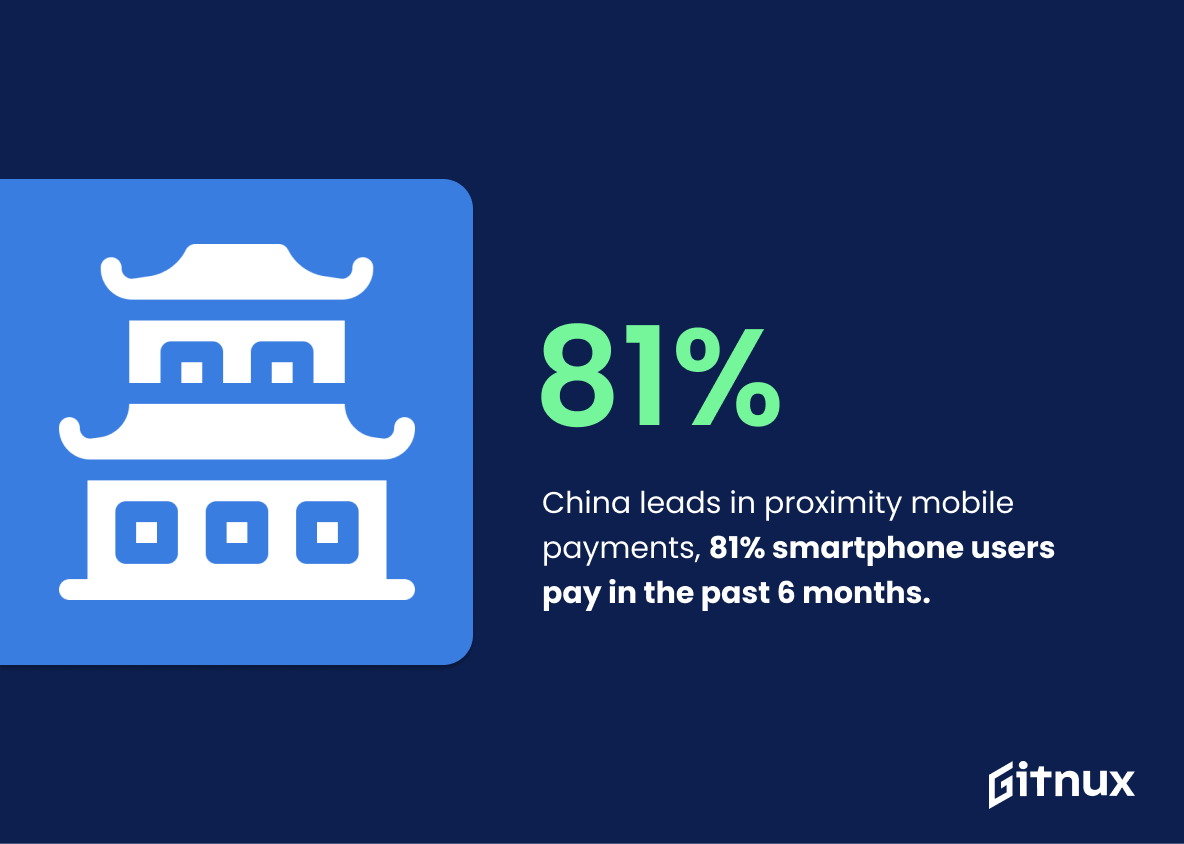
China leads the world in proximity mobile payment adoption, with 81% of smartphone users making a payment in the past 6 months.
Mobile payments are becoming increasingly popular in China, which could have implications for other countries looking to adopt similar payment systems.
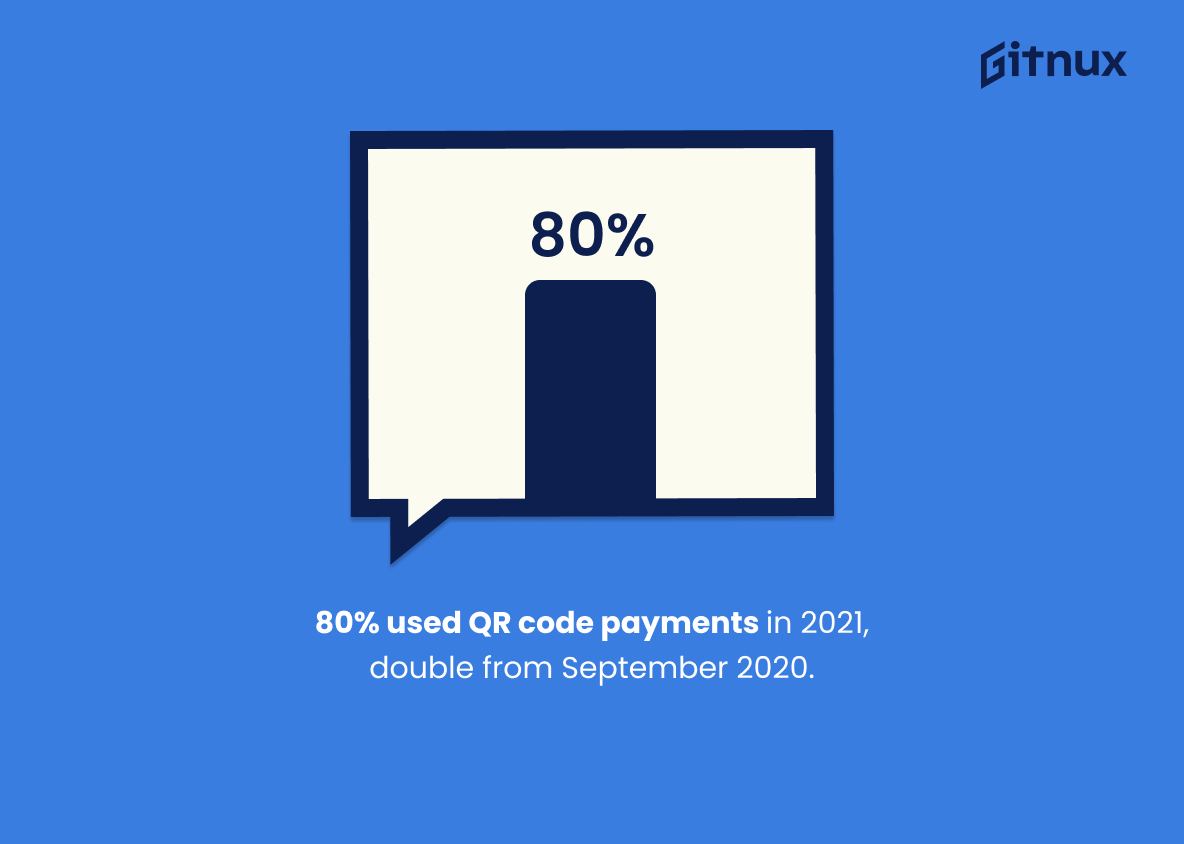
8 out of 10 respondents have used QR code payments at least once in 2021, double the amount from September 2020.
This statistic shows the rapid growth of QR code payments in 2021, indicating that this type of mobile payment is becoming increasingly popular. It could be due to the convenience of QR code payments, as well as the increased security measures that have been implemented to protect users.
This trend could also have implications for the future of mobile payments, as more people may be encouraged to use this payment type in the future.
Statistics about Mobile Payment Types
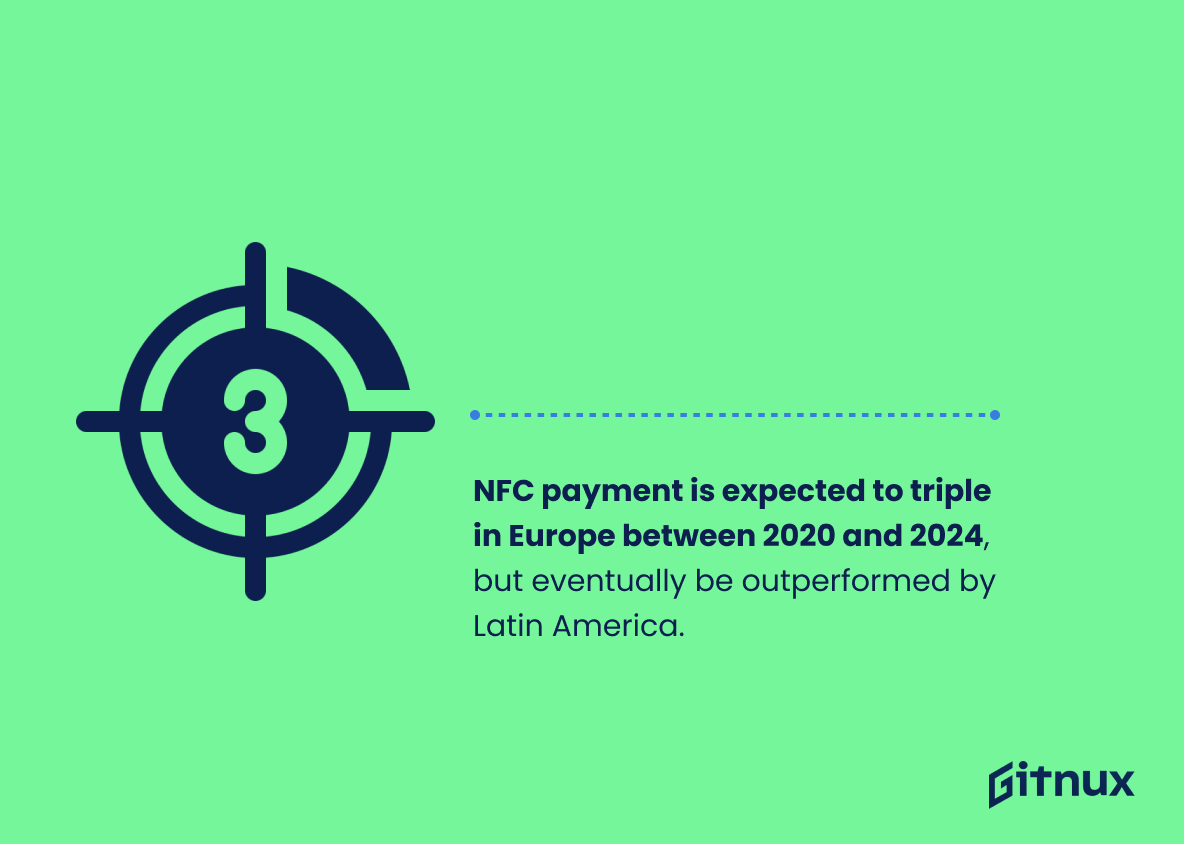
NFC payment is expected to triple in Europe between 2020 and 2024, but eventually be outperformed by Latin America.
This shows the potential for growth in different regions, and the potential for NFC payment to become more popular in different parts of the world.
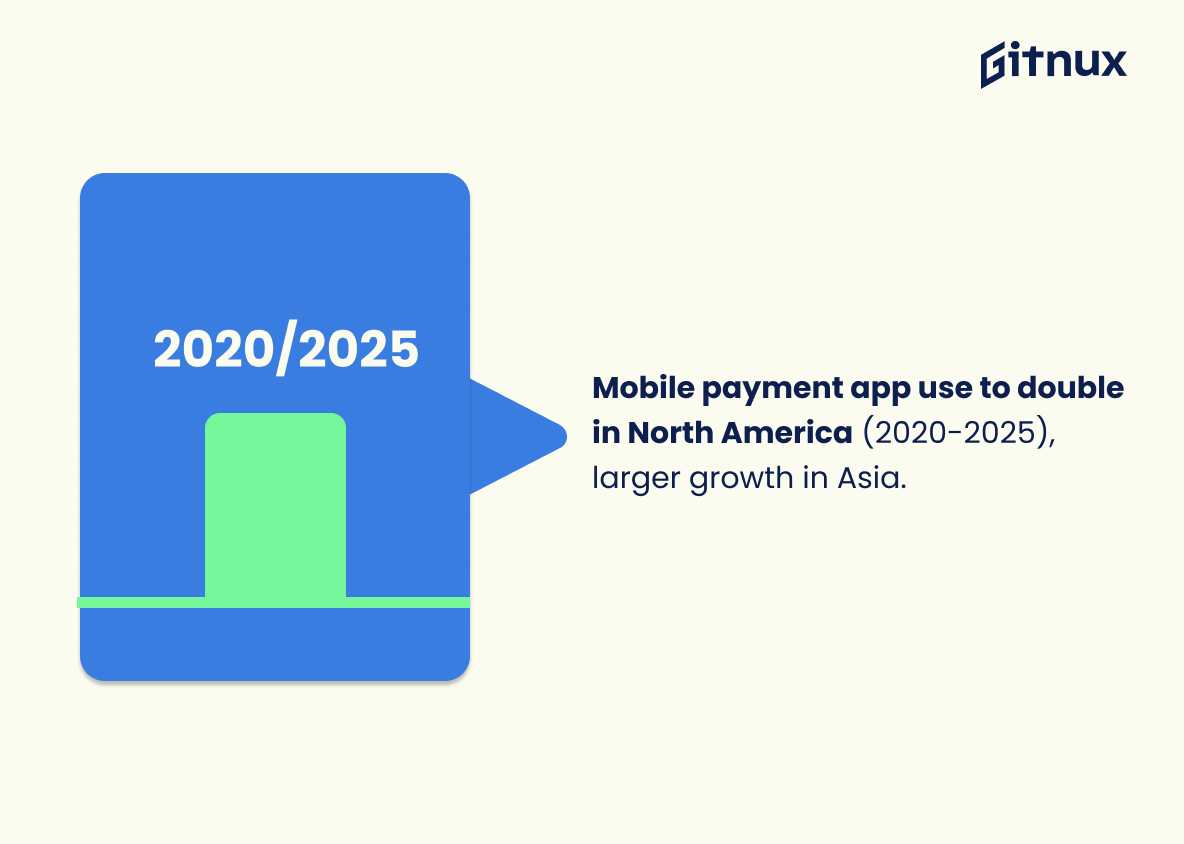
The use of mobile payment apps like Apple Pay and Google Pay is expected to double in North America between 2020 and 2025, while Asia’s market size will be significantly larger.
This statistic highlights the potential growth of mobile payment technology in North America and Asia, and the potential for mobile wallets to become a major form of payment. This could have a significant impact on the global mobile payment market.
Mobile Payment Popularity Statistics
Digital and mobile wallets accounted for roughly half of global e-commerce payment transactions in 2021, and this share is set to increase to over 53 percent in 2025.
These data show the growing popularity of digital and mobile wallets as a payment method, which is likely to continue to increase in the coming years. They also highlight the need for businesses to be aware of the potential of mobile payments and to consider investing in mobile payment solutions to ensure they are able to keep up with customer demand.
Convenience-oriented businesses are more likely to offer cryptocurrency solutions than others in 2021, with 6,000 of these companies located in the US.
It displays that cryptocurrency is becoming increasingly popular, and that businesses are beginning to recognize the potential of this form of payment. This could also lead to more businesses offering cryptocurrency solutions in the future, which could lead to an increase in mobile payment usage.
Mobile Payment-Apple Target Market
Over 1.65 billion Apple devices are currently used across the world. Under that, iPhone usage is distributed almost 50/50 between men and women. More than half of all US-based MacBook users are from small towns and rural areas.
Furthermore, over 10% of iPhone owners own Apple Watches. Almost 85% of current iPhone users
plan to purchase another iPhone. In addition, one in five consumers who own both an iPad and an iPhone think switching ecosystems would be harder than changing bank accounts.
Although nearly 100% of iPhone users have tried Siri, most don’t use it regularly.
The iOS users account for 30% of mobile device users globally.
More than half of all US-based MacBook users are from small towns and rural areas. Additionally, over 10% of iPhone owners also own Apple Watches.
Moreover, one in five consumers who own both an iPad and an iPhone think switching ecosystems would be harder than changing bank accounts.
About 34 million people bought Apple watches in 2020 and almost 85% of current iPhone users plan to purchase another iPhone.
See also our latest Digital Transformation Statistics
Conclusion
In conclusion, mobile payments are becoming increasingly popular as more and more people are turning to their smartphones to make payments.
Mobile payments offer convenience and security, and the statistics show that mobile payment usage is growing rapidly. As the technology continues to evolve, it is likely that mobile payments will become even more popular in the future.
References
1 – https://www.statista.com/statistics/244501/share-of-mobile-phone-users-accessing-proximity-mobile-payments-country/
2 – https://www.statista.com/statistics/333905/mobile-payment-types-most-likely-successful/
3 – https://www.statista.com/statistics/1227815/contactless-payments-worldwide-by-region/
4 – https://www.statista.com/statistics/1227576/mobile-wallet-transactions-worldwide/
5 – https://www.statista.com/statistics/1111233/payment-method-usage-transaction-volume-share-worldwide/
6 – https://www.statista.com/statistics/1222768/business-types-with-crypto-payment-solution/
7 – https://www.businessofapps.com/data/mobile-payments-app-market/
8 – https://www.businessofapps.com/data/mobile-payments-app-market/
9 – https://www.businessofapps.com/data/mobile-payments-app-market/
10 – https://serpwatch.io/blog/apple-customer-demographics/
