In today’s fiercely competitive retail landscape, success hinges on the ability to make informed decisions backed by accurate data. As a retailer, leveraging effective Key Performance Indicators (KPIs) is critical for maximizing the potential of your merchandising strategy, ensuring your inventory is well-managed, and optimizing your store’s profitability.
This in-depth blog post will delve into the world of Merchandising KPIs, unraveling the complexity behind these essential metrics, and providing actionable insights that will empower you to maximize your retail operations, make data-driven decisions, and ultimately, surpass the competition.
Merchandising KPIs You Should Know
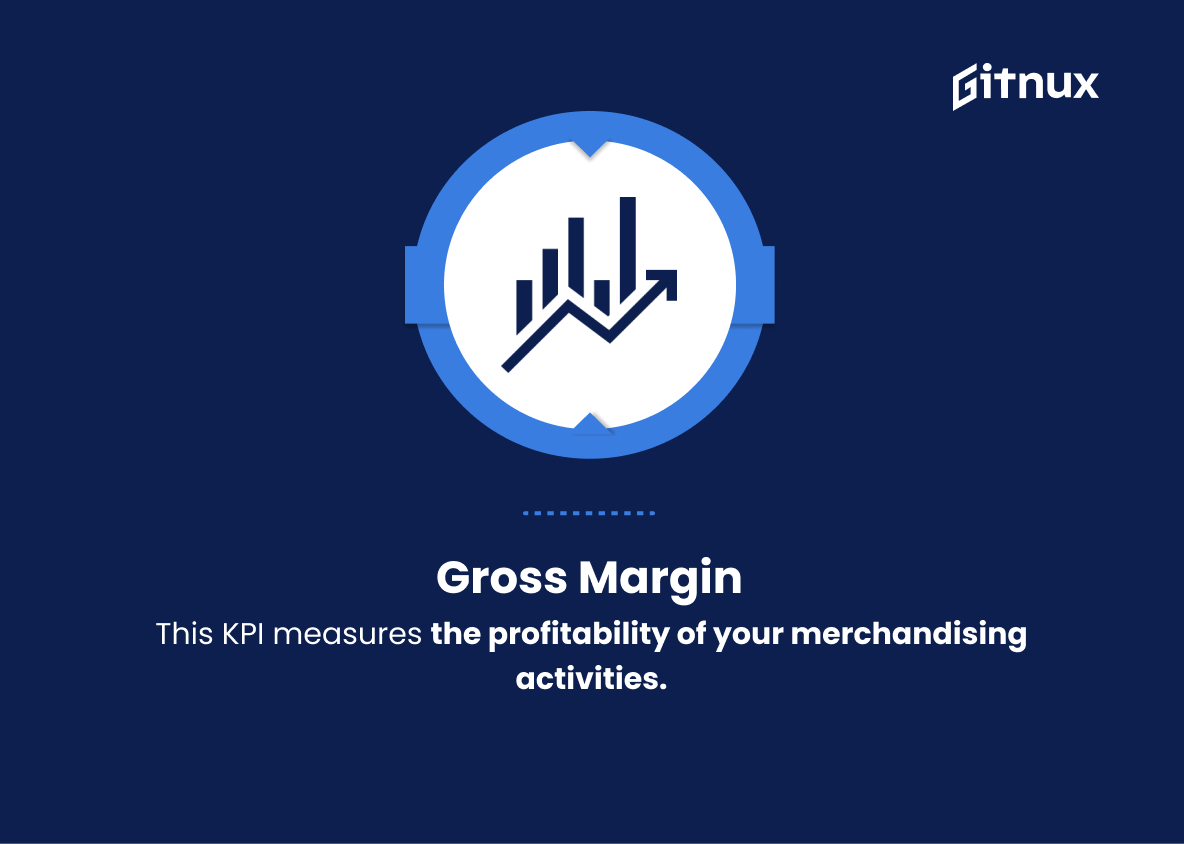
1. Gross Margin
This KPI measures the profitability of your merchandising activities. It is calculated as the difference between the selling price and the cost of goods sold (COGS), expressed as a percentage of the selling price. A higher gross margin indicates effective pricing and purchasing strategies.
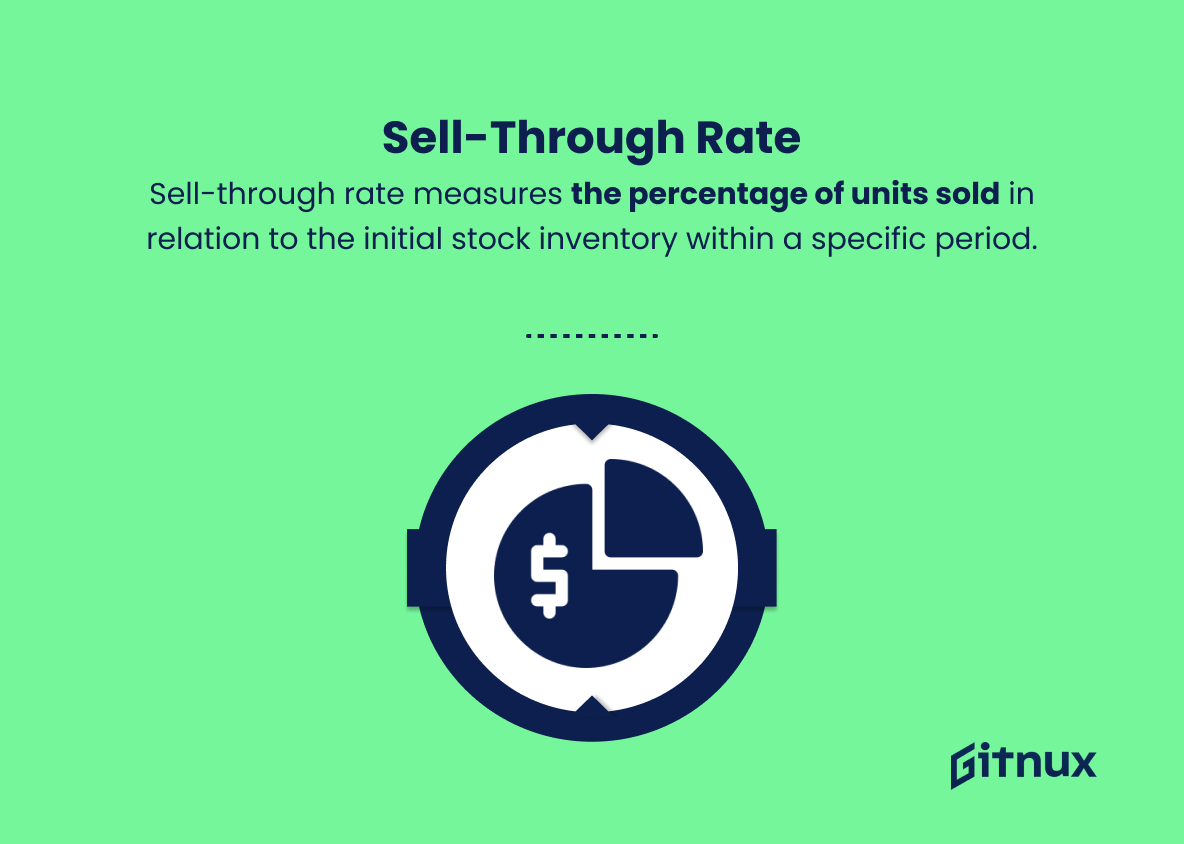
2. Sell-through Rate
Sell-through rate measures the percentage of units sold in relation to the initial stock inventory within a specific period. Higher sell-through rates indicate that the products are moving quickly, which helps to optimize inventory levels and increase overall sales.
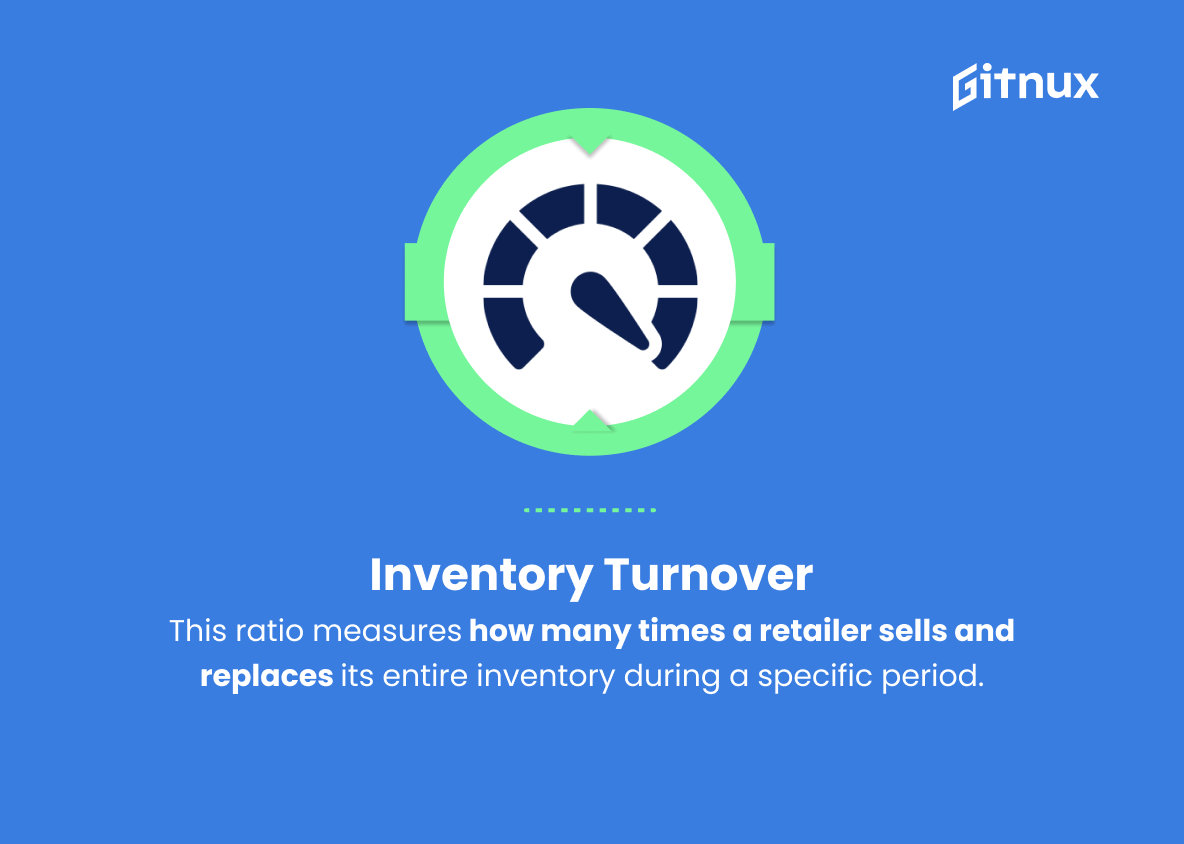
3. Inventory Turnover
This ratio measures how many times a retailer sells and replaces its entire inventory during a specific period. A higher turnover rate indicates efficient sales and inventory management.
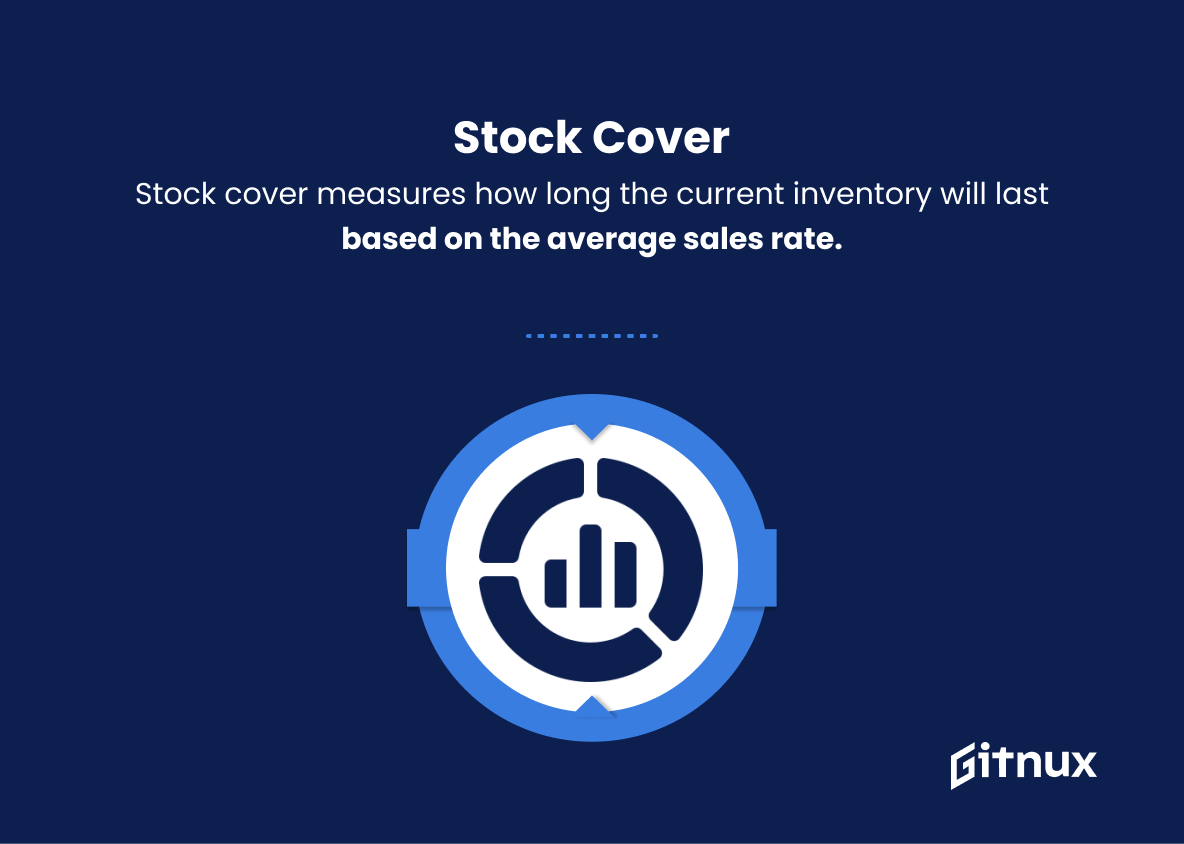
In today’s fiercely competitive retail landscape, success hinges on the ability to make informed decisions backed by accurate data.4. Stock Cover
Stock cover measures how long the current inventory will last based on the average sales rate. It helps in estimating the ideal inventory levels to maintain to prevent stock-outs or overstocking.
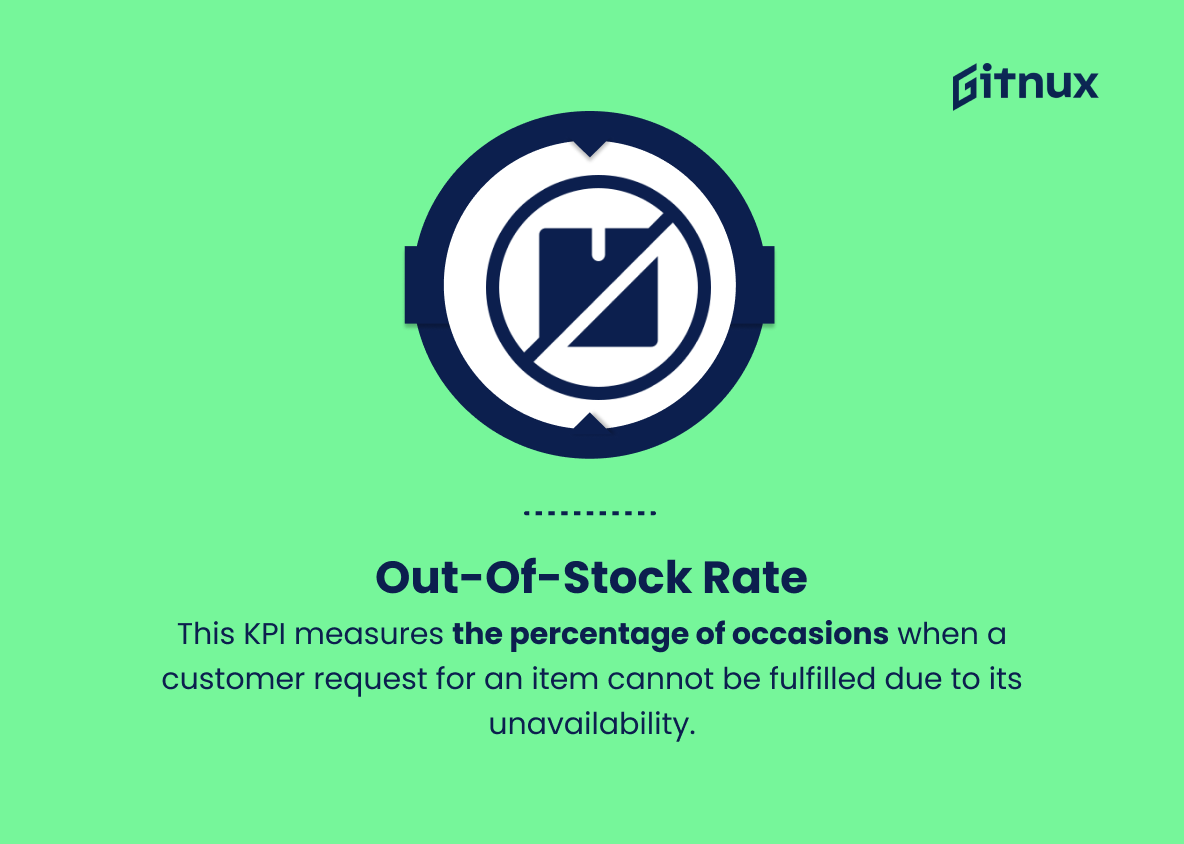
5. Out-of-Stock Rate
This KPI measures the percentage of occasions when a customer request for an item cannot be fulfilled due to its unavailability. A low out-of-stock rate is desirable to ensure customer satisfaction and prevent lost sales opportunities.
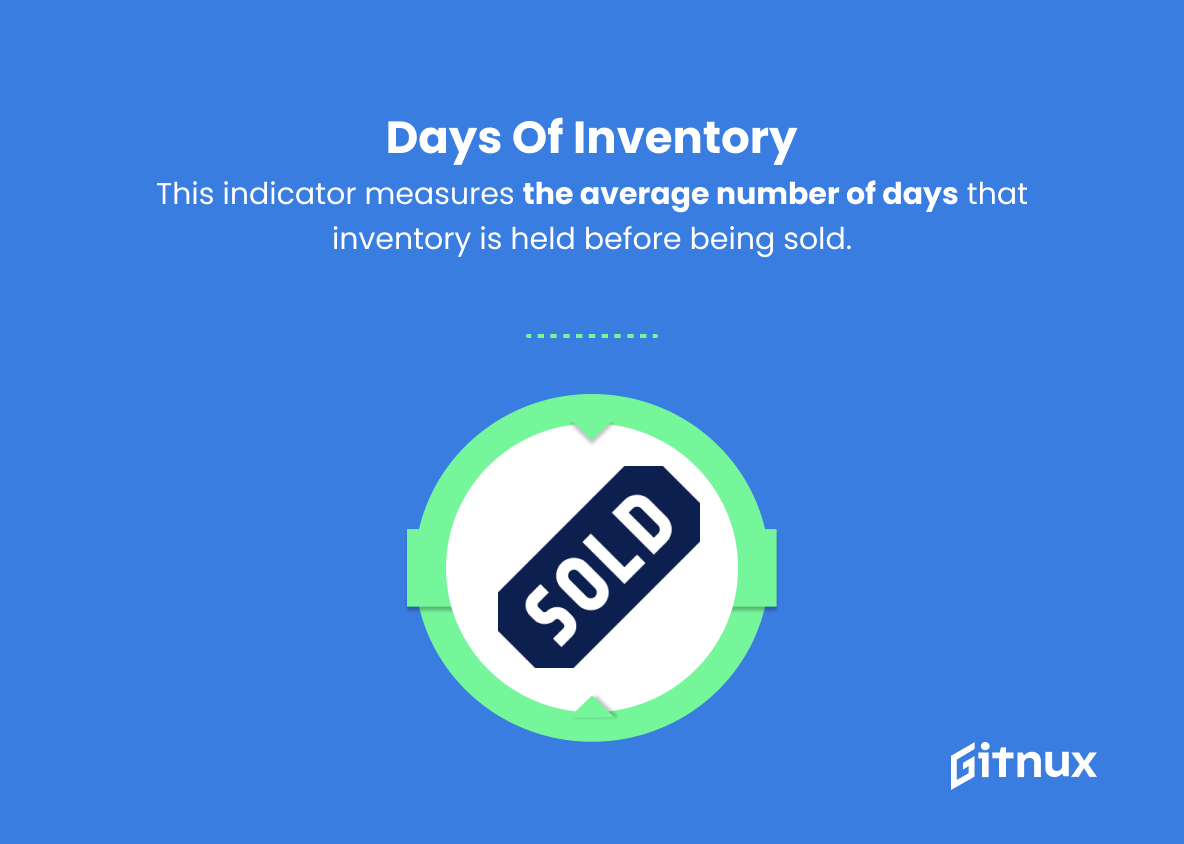
6. Days of Inventory
This indicator measures the average number of days that inventory is held before being sold. A lower number indicates efficient inventory management and faster inventory turnover.
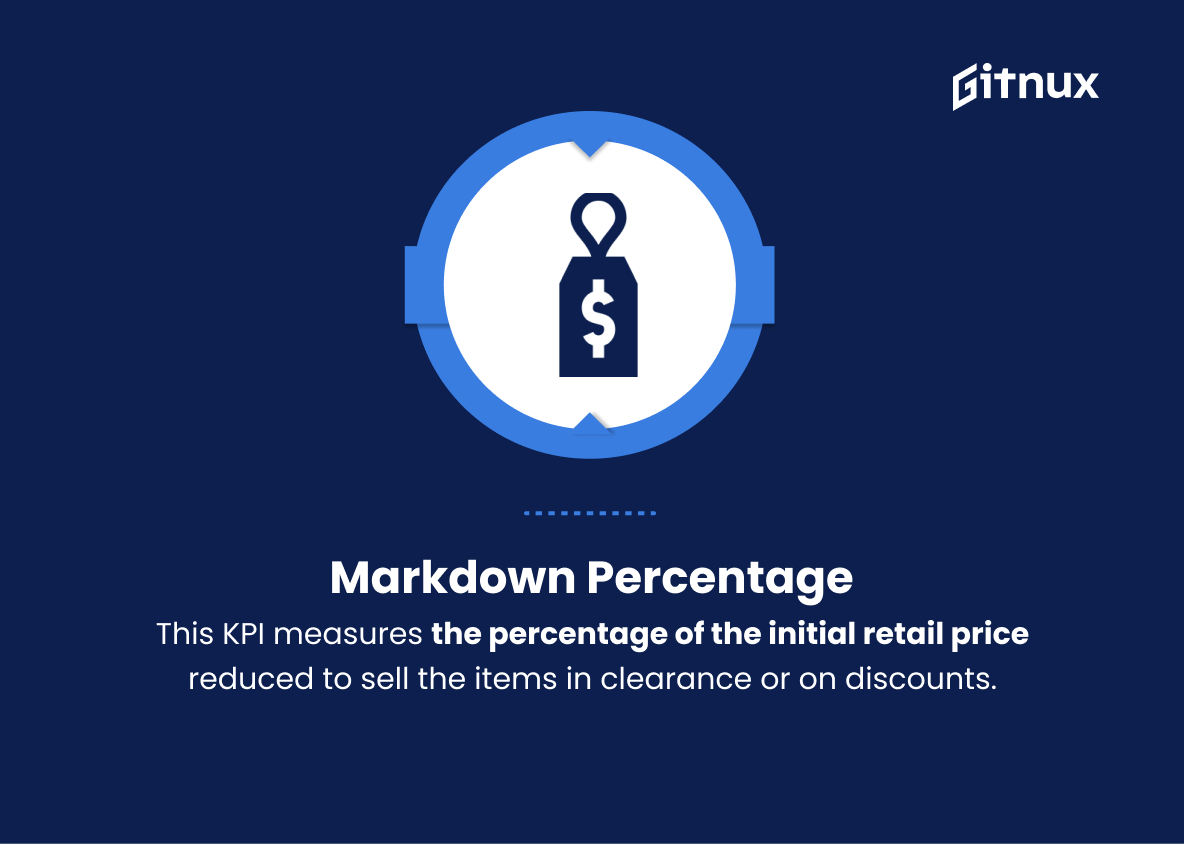
7. Markdown Percentage
This KPI measures the percentage of the initial retail price reduced to sell the items in clearance or on discounts. Managing the markdown percentage is essential for maintaining good profit margins and clearing slow-moving items without negatively impacting the brand’s value.
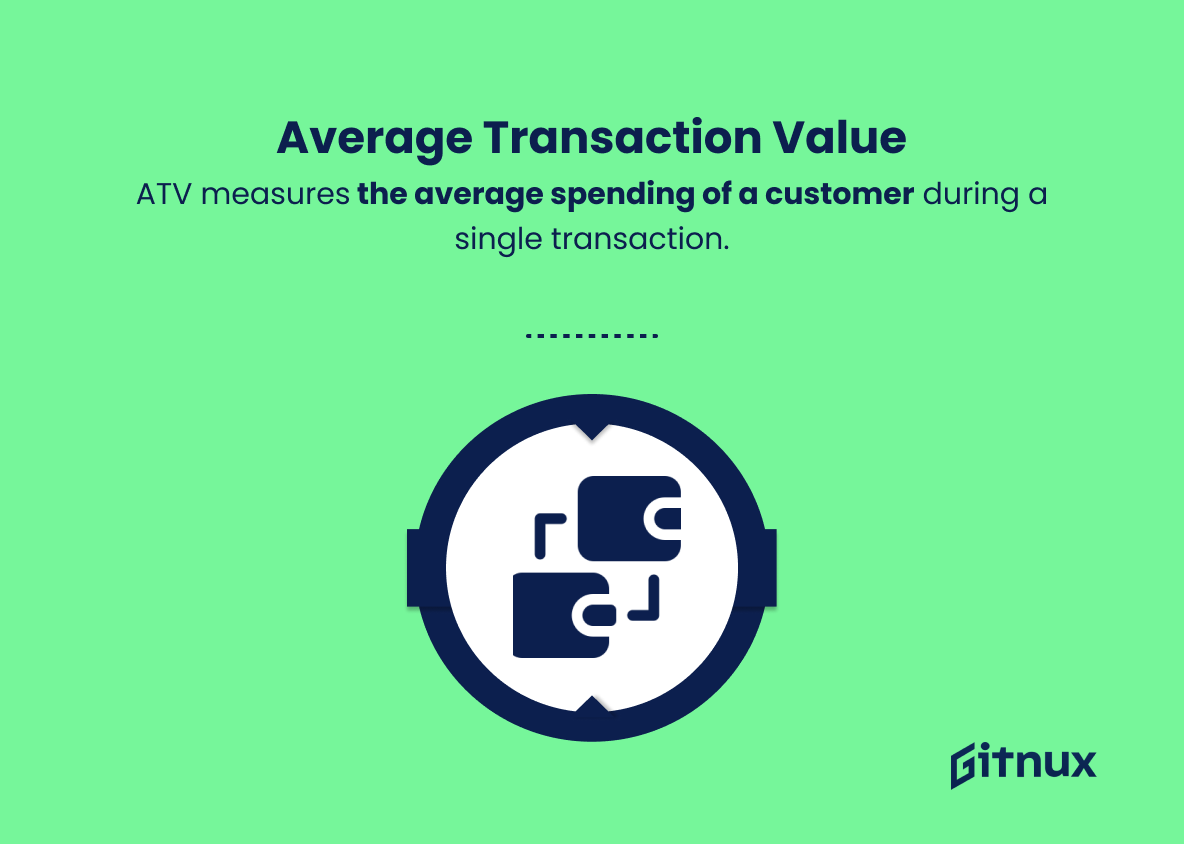
8. Average Transaction Value (ATV)
ATV measures the average spending of a customer during a single transaction. Increasing the ATV through upselling or bundling strategies can help improve overall revenue.
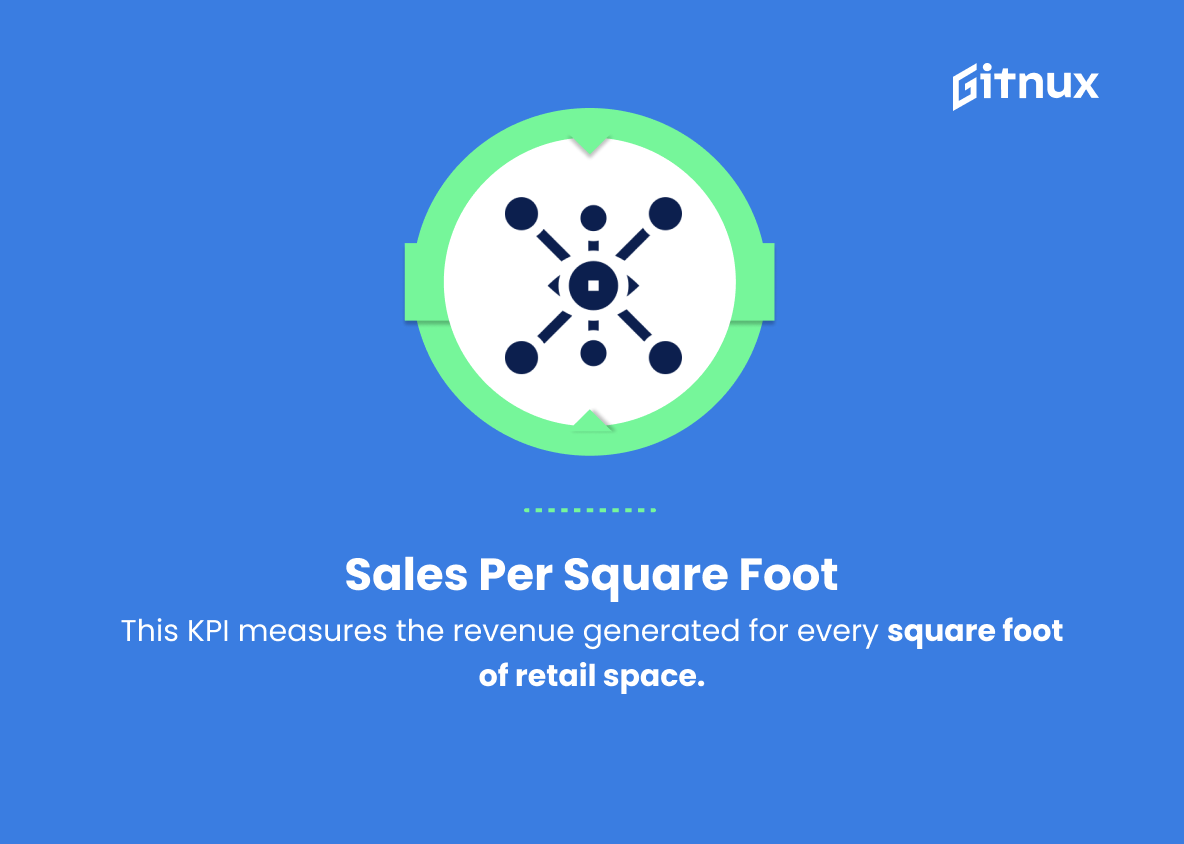
9. Sales per Square Foot
This KPI measures the revenue generated for every square foot of retail space. A high sales-per-square-foot ratio indicates efficient use of the store’s space and better product placement.
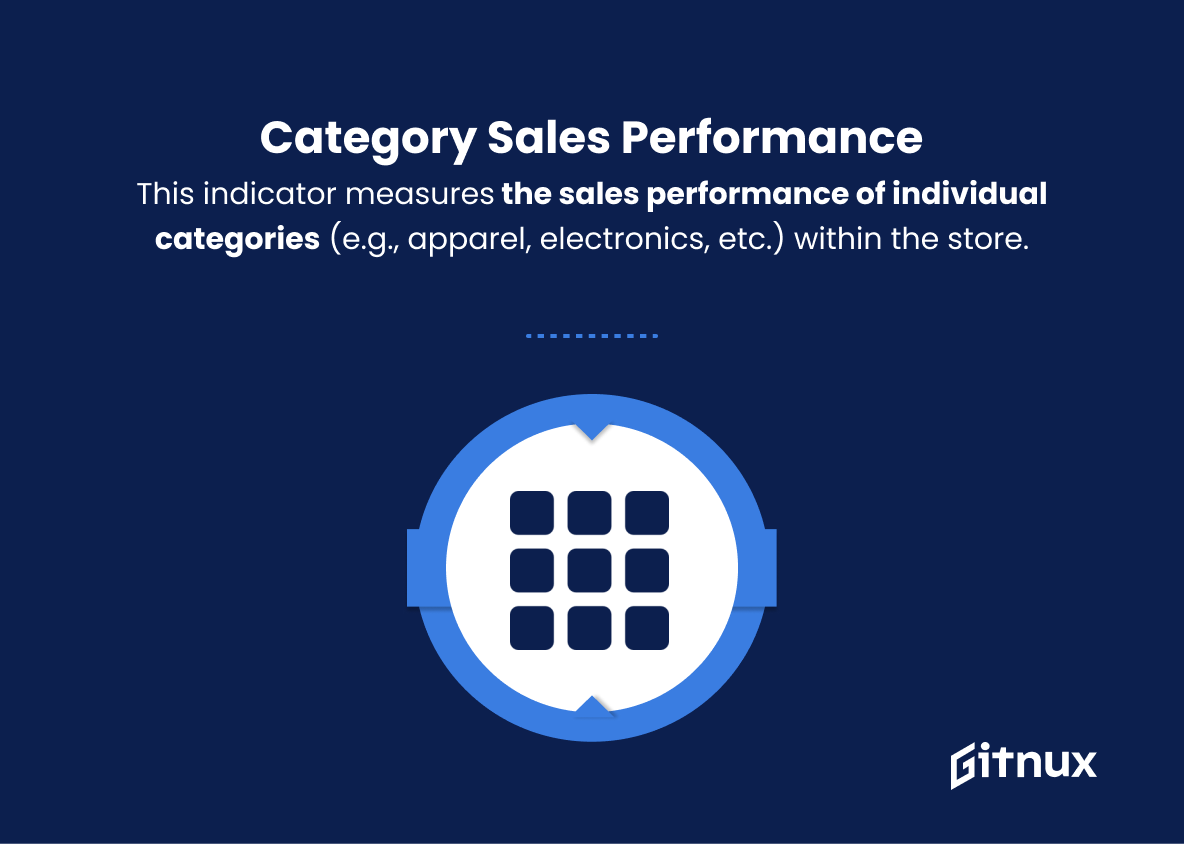
10. Category Sales Performance
This indicator measures the sales performance of individual categories (e.g., apparel, electronics, etc.) within the store. Analyzing these KPIs can provide insights into which categories are driving sales and identify areas for improvement.
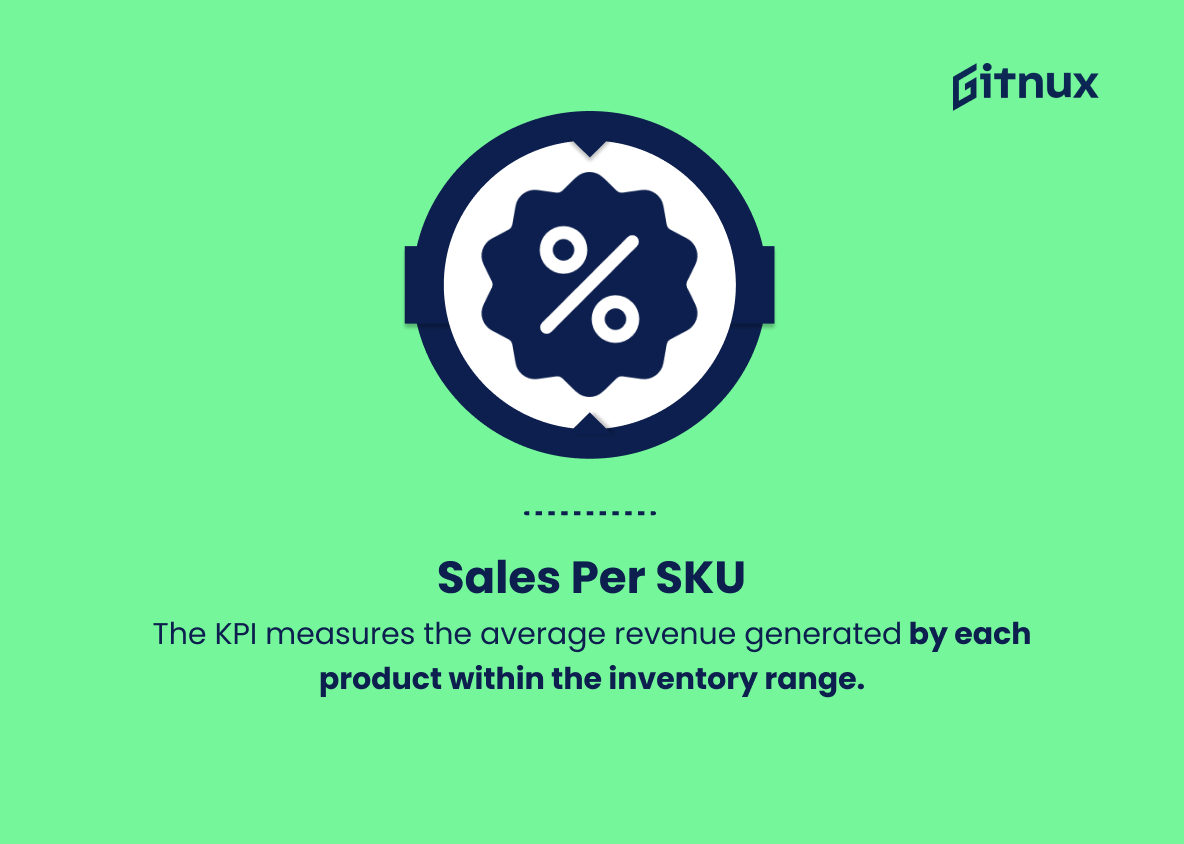
11. Sales per SKU
The KPI measures the average revenue generated by each product within the inventory range. It helps identify the best-selling products and optimize the product assortment accordingly.
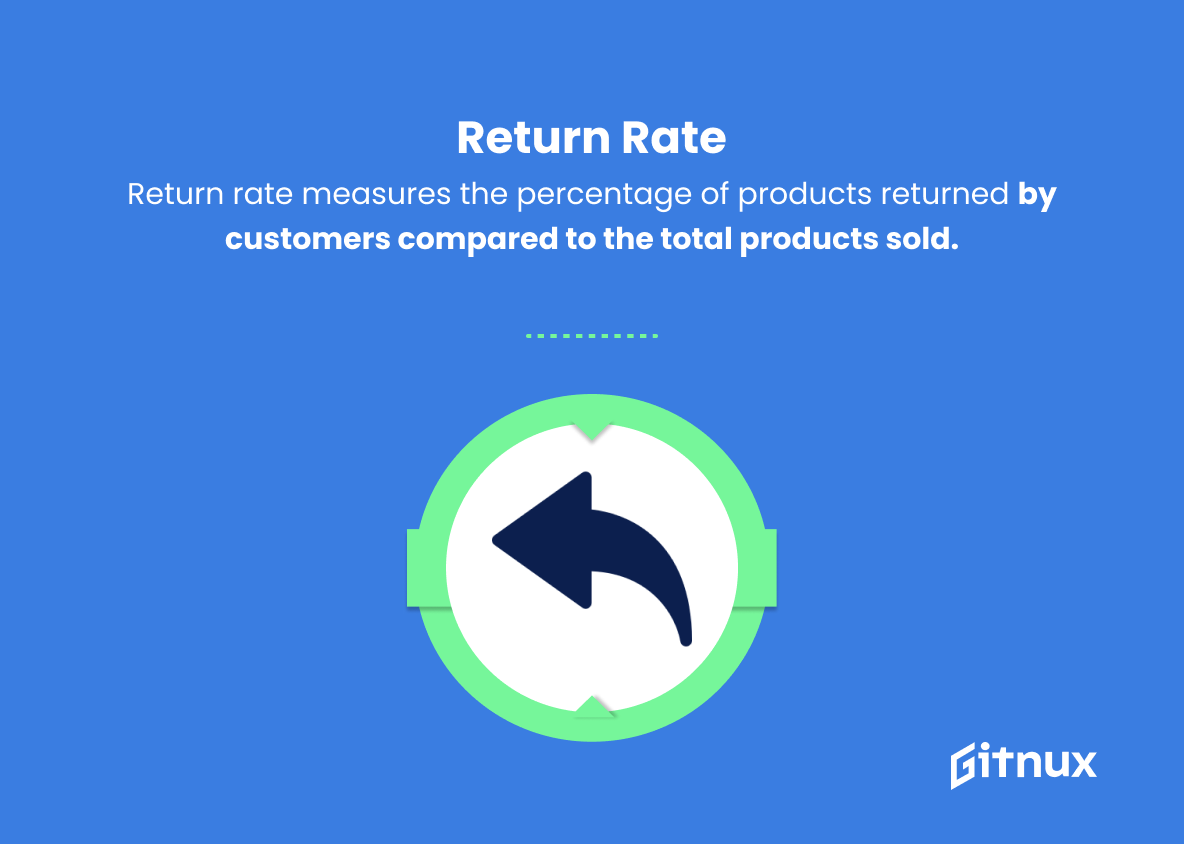
12. Return Rate
Return rate measures the percentage of products returned by customers compared to the total products sold. A high return rate could indicate a problem with product quality or customer satisfaction, requiring immediate attention.
13. Conversion Rate
This KPI measures the ratio between the total number of store visitors and actual purchasers. A high conversion rate indicates that your merchandising strategies are effective in driving sales from store traffic.
Merchandising KPIs Explained
Merchandising KPIs play a crucial role in understanding the effectiveness of a retailer’s strategies and identifying areas for improvement. Gross margin measures the profitability of merchandising activities and helps determine proper pricing and purchasing strategies. The sell-through rate and inventory turnover indicate how efficiently products are moving through the store, while stock cover and out-of-stock rate help maintain optimal inventory levels to minimize stockouts and overstocking. Days of inventory and markdown percentage provide insights into inventory management efficiency and clearance strategies.
The average transaction value, sales per square foot, category sales performance, and sales per SKU help retailers better understand and optimize customer spending, store space utilization, and product assortment. Return rate and conversion rate serve as essential indicators of product quality, customer satisfaction, and the effectiveness of merchandising strategies in driving sales from store traffic. Monitoring and analyzing these KPIs allows retailers to continuously adapt and improve their approach and ultimately enhance their overall performance.
Conclusion
In summary, merchandising KPIs are critical for businesses to evaluate their performance, optimize their strategies, and achieve better results. By tracking and analyzing these key performance indicators, retailers can gain valuable insights into customer preferences, product offerings, and overall store performance. So, it is crucial for both online and brick-and-mortar retailers to identify the right set of KPIs based on their specific goals and objectives, and continuously monitor them to make informed decisions. By doing so, businesses can stay competitive in today’s fast-paced market, accelerate growth, and maximize profitability. Remember, when it comes to effective merchandising, the continuous improvement and adaptation of strategies is vital for long-term success.
