How To Build A Business Case

Learn to craft a compelling business case step-by-step. Identify market size and revenue potential variables, structuring your approach accordingly. Gather essential data and calculate revenue potential. Delve into potential expenses, making accurate projections. Finally, assess profitability to determine the viability of your venture. Through this guide, master the art of building a robust business case, equipped with thorough market analysis and financial projections, ensuring informed decision-making and strategic planning.

Updated: April 16, 2024

In the ever-changing realm of business, ensuring the financial viability of your ideas is paramount. Whether you’re a visionary entrepreneur or a seasoned corporation, constructing a solid business case is imperative. It serves as the foundation for assessing the potential success of your ventures, guiding strategic decisions and resource allocation in an ever-shifting marketplace.

In this guide, we will delve into the essential components of building a robust business case, providing practical insights and step-by-step guidance to help you navigate the complexities of financial planning and strategic decision-making.

Note: 🍋 Throughout this guide we will use the example of a food supplement company to better illustrate each task and information.

What is a Business Case?

Ultimately, you want to build a business case, that is a financial model to validate the financial viability of your business idea. A business case or financial model is a structured approach to forecasting the financial performance of a business or project, usually over a multi-year period.

A business case helps you to understand the profitability of your business idea by making projections about your revenue potential and the needed expenses over the coming years. The financial model can also include various scenarios to help assess the potential impact of different levers such as changing economic conditions, pricing assumptions, or other factors that could affect the business’s financial performance.

So what we will do in this guide is look at both sides, your revenue potential and how it could develop over time considering different effects and your estimated expenses (Capex & Opex) and how they could develop over time. We will start by looking into the revenue side of your business case, estimating your market size and revenue potential. 

What are the Benefits of Building a Business Case?

Building a business case is essential for providing a comprehensive understanding of your business idea’s financial viability and potential for success. By developing a structured financial model, you can:

  • Assess Financial Viability: Evaluate the profitability and sustainability of your business idea by forecasting revenue potential and estimating expenses over time.
  • Make Informed Decisions: Utilize the insights generated from the business case to make informed decisions about resource allocation, investment opportunities, and strategic direction.
  • Identify Risks and Opportunities: Identify potential risks and opportunities early on by analyzing different scenarios and their impact on the business’s financial performance.

A well-defined business case is crucial for all types of businesses, providing a roadmap for financial planning and strategic decision-making.

  • For Entrepreneurs, developing a robust business case is essential for securing funding, attracting investors, and validating the viability of their business ideas.
  • For Start-Ups, a comprehensive business case serves as a roadmap for growth, helping to secure funding, gain market traction, and navigate the challenges of scaling.
  • For Corporates, building a solid business case facilitates strategic planning, innovation management, and the successful implementation of new initiatives.
  • For Investors, evaluating a business case provides critical insights into potential investment opportunities, helping to assess risk, return potential, and alignment with investment objectives.

Need help?

We can also conduct a Business Case for you, or you can work with our ready-to-use templates to save valuable time.

Our Tutorial: Step-by-Step

1

Step 1: Get Prepared

To build your business case you can either build your own spreadsheet template for example on Google Sheets or you can use our ready-to-use template along with this guide.

Business Case Template

Included Templates:

  • ✅ Business Case Spreadsheet Model
Next Step
2

Step 2: Identify your Market Size

To estimate the revenue potential for your product, service or business opportunity, you will need to analyze the size of your market .

Market sizing is not only an interview question that most consulting candidates face,  but also a valid method used by businesses to estimate the total potential revenue or market share for a product or service in a given market.

Three concepts that are typically used to estimate the market size are the TAM, SAM and SOM:

  • TAM stands for Total Addressable Market, which is the total revenue opportunity available in a market.
  • SAM stands for Serviceable Addressable Market, which is the portion of the market that a company can realistically target with its products or services.
  • SOM stands for Serviceable Obtainable Market, which is the portion of the SAM that a company can realistically capture with its products or services.

There are a few different ways to approach market sizing top down and estimate the potential revenue for a new product, depending on the information that is available.

The industry size as a starting point:

One way is to look at the revenue generated by other businesses in your sector or industry and use that as a starting point for your estimates. 🍋For example, if you are trying to estimate the potential revenue for a new food supplement, you can take the total revenues of food supplements in a country market as a basis and start from there.

The potential customer base as a starting point:

Another way to estimate the potential revenue is by using data on the size of the potential customer base, to determine the total number of people who might be interested in buying the product, and use this as a basis for your estimation. 🍋For example, if we are trying to estimate the potential revenues for a food supplement brand, we would take the total number of people who fall into our main target segment (e.g. men and women between 35 and 65) in a country market and start from there.

Whatever method you choose really depends on what type of information you have at hand and is easier for you to gather. Since you probably already collected some data on your potential customer base during the customer deep dive yesterday, you might go with the second one.

To estimate your market size you need to be clear about your target market. Meaning you want to use different variables to narrow down the target customer group(s) you want to offer your product or service to.

This is something you usually do at the initial stage of your business building process. If you completed the previous toolkits, you definitely did. If you worked on your own so far you hopefully did specify your target segment when doing your customer analysis or when defining your business model. However, in the case you didn’t go ahead and think about who your target customer are, using segmentation variables like:


  • Geographic variables: These variables refer to the location of a person or business, such as country, state, city, neighborhood, or zip code. Geographic variables can be used to understand differences in consumer behavior, preferences, and market demand based on location.
  • Demographic variables: These variables refer to the personal characteristics of an individual or group, such as age, gender, income, education level, occupation, marital status, and ethnicity. Demographic variables can be used to understand differences in consumer behavior, preferences, and market demand based on personal characteristics.
  • Firmographic variables: These variables refer to the characteristics of a business, such as industry, company size, location, revenue, and number of employees. Firmographic variables can be used to understand differences in business behavior, preferences, and market demand based on industry and company size.
  • Behavioral variables: These variables refer to the actions and behaviors of consumers, such as purchasing habits, product usage, loyalty, and brand awareness. Behavioral variables can be used to understand differences in consumer behavior and preferences based on their actions and behaviors.
  • Psychographic variables: These variables refer to the attitudes, beliefs, values, and lifestyles of consumers, such as personality traits, interests, hobbies, and opinions. Psychographic variables can be used to understand differences in consumer behavior and preferences based on their attitudes and values.
Next Step
3

Step 3: Revenue Potential Variables & Structure

Before starting to collect further data and making your calculations, you should be clear about how you want to structure your case and which variables it includes that can affect the size of the market in order to search for the right data.

Let’s go back to the very basics. So, the formula to calculate your potential revenues could look for example as follows:

number of customers x average spend per year (average number of units per year average price) = potential revenues per year

Therefore, first of all you want to find out the number of potential customers. If you offer B2C products/services these will be of course individual people or households, if you are selling B2B products/services those would be businesses.

Number of potential customers

To break down the number of potential customers we will use the TAM, SAM and SOM.

TAM: Number of consumers that fall into your target segment

Number of people/businesses in your geographic market

  • Number of people/businesses in a certain country
  • Number of people/businesses in a certain region or city in case your sales area is limited to those

And out of those the number or % of people who fulfill your demographic/firmographic segmentation criteria e.g.

For B2C consumers this could be:

  • Number or % of people who are a certain gender
  • Number or % of people who fall into a certain age group 
  • Number or % of people with a certain income level
  • Number or % of people with a certain profession
  • Number or % of people with a certain family status
  • Number or % of people with a certain number of children
  • Number or % of people with a certain household size
  • Number or % of people with a pet
  • etc.

For B2B consumers this could be:

  • Number or % of businesses that have a certain company size 
  • Number or % of businesses that gain certain company revenues 
  • Number or % of businesses that belong to a certain industry/sector
  • Number or % of businesses that have a certain company age
  • etc.

Think about all the criteria you defined for your target segment that could help to narrow down your market.

SAM: Number or % of consumers that are interested in the type of product/service you sell

This one is a little trickier and not as straightforward as geographic and demo/firmographic variables. Sometimes you might be lucky and find direct consumption data on a certain product or service from consumer research e.g. 🍋 “X% of people say they consume food supplements.”

But in most cases you will have to derive data in an indirect way.

Think for example about the reasons why certain people would consume a product/service. Some example could be:

  • People with acne consume acne cream → Find out: What % of people suffers from acne
  • People who are environmentally conscious buy from a second hand shop → Find out: What % of people say they live an environmentally conscious lifestyle?
  • Startups that receive funding heavily invest in marketing services → Find out: How many startups receive funding every year?

You get the point right? You will need to try to find ways to derive the number of people/business that potential would buy a product like yours.

SOM: Number of consumers that choose your brand instead of those of competitors

To estimate the number of people who would choose your brand you can look at variables such as the marketing and purchase channels.

For example if you purely sell online via your own online shop, try to find indicators of what % or number of people/businesses use this purchasing channel.

However, to further break it down you will most likely have to make your own assumptions. To get an approximation you could research similar businesses like yours and try to figure out how much market share they captured in their first year of business.

Take into consideration that market share you are able to grab is very closely related to how much you spend on marketing activities to get the awareness of potential customers. So if your business is new,  and not funded by external investors you probably will have a very limited budget to spend, therefore be realistic and use a rather pessimistic approach to estimate your share.

Average spend per year:

Once you have the number of your potential customers, you want to figure out how much they would spend on average per year on your product/service.

There are different types of variables you can use to estimate an average spend per year, again this depends on which information you have available.

  • Average spend per year: You probably find data that directly states how much a person spends per year on a certain product/service
  • Average purchasing volume per year: Or you can use data on the average number of units/frequency a person purchases of a product/service in a year.
  • Average price:  average price you could charge for your product/service (based on competitor data)

Take then the average number and multiply it by the average price to get the average spend per year.

It is of course possible that you will find this data but for a different time span. So for example instead of the average spend in a year you find data on the average spend in a month or a week. In this case, of course, you’ll need to bring it to the time frame of a year. You then also want to take into account seasonalities, meaning the average spend or volume can differ depending on the season or month of the year. 🍋 For example, the consumption and therefore spend on the food supplement vitamin D will be higher during winter in countries in the Northern Hemisphere due to the lack of sunlight.

With these variables,  you should be able to calculate your potential revenues per year.

Next Step
4

Step 4: Data Collection

Once you have defined the structure and variable for your market sizing case, you will need to gather data on those variables.

Initially you may not have enough data to make a precise estimate of the market size. In these cases, you will need to make assumptions and estimates based on the available data and your knowledge of the market.

  • So, you can of course use any data that you have gatherers so far from market, competitor and customer research, initial testing or the validation experiments you conducted up to this point,
  • Then you can of course, as any good consultant would, just google for the specific information you need.
  • Also, there is a variety of public information available on population, industry and even consumer data, below you will find a curated 📋List of resources that you can look at.
  • Remember, you can still refine your business case later by adjusting your data with the results you get from your validation experiments. business case

Next Step
5

Step 5: Calculate your Revenue Potential

When you have collected the data you need, you can start to analyze it to calculate the potential size of the market.

Use your market sizing spreadsheet and go step by step:

  1. Calculate the TAM
  2. Calculate the SAM
  3. Calculate the SOM (potential customer base)
  4. Calculate the average spend
  5. Multiply the average spend with the potential customer base

Now you should have an estimation of your potential revenues in year 1.

However, you not only want to know how much you could be able to earn in the first year but also over time, for example within the next 3 or 5 years. You want to figure out the growth potential for your product/service revenues by applying a growth rate.

You can apply a growth rate to both:

  • Your customer base: meaning your loyal customer base grows over time. Of course you will also have customer churn, but you will hopefully acquire more new customers than those that will leave you so your total customer base grows.
  • The average spend: meaning the average spend of the individual customers can also grow over time because they become more loyal to your brand.

Also, your growth potential for each can depend on external as well as internal factors.

External factors – meaning the growth of the general demand in this industry.

For external growth, you can estimate a Compound Annual Growth Rate (CAGR)for any market evolution data you collected. The CAGR is the measure of the average growth over a specified period of time, typically measured in years. It is calculated by taking the nth root of the total percentage growth of a value, where n is the number of years in the period. The formula looks as follows:

CAGR = (Ending value / Beginning value) ^ (1 / n) – 1

For example, if you got a beginning value of $100 and an ending value of $120 after 3 years, the CAGR would be calculated as follows:

CAGR = ($120 / $100) ^ (1 / 3) – 1 = 1.086 – 1 = 0.086 = 8.6%

So you could for example try to find data on how your industry’s revenues have evolved over the last years, calculate the CAGR and project this on your potential revenues by applying the same % growth rate.

Internal Growth – On the other hand, you can have internal growth factors for example through increasing your marketing budget. The more marketing money you spend the more people will become aware of your product/service, the more you can convert to customers and increase your market share vs. competitors.

So think about how much (%) you could be able to increase your marketing budget over the next 5 years and what impact (%) this could have on your revenues. Of course, if your business is new and you don’t have any past data available that serve as an evidence for the impact of your marketing spend on your sales, you will have to make an assumption again.

Now that you have those to % figures you will have to calculate the weighted average of both to get a global potential growth rate.

So you will first need to decide on the weight of your external factor and the internal one and with this calculate the weather average.

For example, let’s say your external factor is EX and your internal factor is IN, with weights of 40% and 60%, respectively. For EX you estimate 4% growth, and for IN you estimate 7% growth . The weighted average of these two factors would be calculated as follows:

(40% * 4%) + (60% * 7%) = 1,6% + 4,2% = 5,8% Growth Rate

Next Step
6

Step 6: Understand and List Potential Expenses

Now that you got an estimate of your potential revenues, let’s move on to calculate your potential expenses on the other side. Any business usually incurs different categories and types of cost, so let’s take a look into the different categories and types of cost and what they are.

CAPEX (Capital Expenditure) represents the investments that a business needs to make in order to acquire or upgrade long-term fixed assets, such as property, plant, and equipment (PP&E). These expenses are typically incurred with the intention of generating long-term benefits and adding value to the company. Examples of capex include building a new factory, purchasing new equipment, or buying a new computer system.

OPEX (Operating Expenses), on the other hand, refers to the ongoing expenses that a company incurs to keep its business running on a day-to-day basis. These expenses are typically recurring in nature and include things like rent, salaries, utilities, and office supplies. Opex is usually considered to be an expense that is necessary to maintain the company’s operations and generate revenue.

COGS (Cost of goods sold) measure the direct costs associated with producing or purchasing goods that are sold by a business. COGS for example include the cost of raw materials, direct labor, manufacturing overhead, and other expenses directly related to the production or acquisition of goods. COGS does not include indirect expenses such as rent, utilities, or administrative expenses, which are typically included in operating expenses (Opex) on a company’s income statement.

Within those categories you can then again differentiate between:

Fixed Costs: Fixed costs are expenses that do not vary with changes in the level of production or sales volume. These costs are generally recurring, ongoing expenses that a business incurs regardless of how much they produce or sell. Examples of fixed costs include rent, salaries for permanent employees, insurance premiums, property taxes, and depreciation of fixed assets.

Variable Costs: Variable costs are expenses that do vary with changes in the level of production or sales volume. These costs are directly related to the amount of product or service a business produces or sells, and tend to increase as production or sales increase, and decrease as production or sales decrease. Examples of variable costs include raw materials, direct labor, shipping and handling costs, and sales commissions.

Semi-variable cost: Semi-variable cost (also known as a semi-fixed cost) is an expense that has both fixed and variable components. These costs have a fixed portion that remains constant over a certain range of activity or production, and a variable portion that changes based on changes in activity or production levels. Examples of semi-variable costs include electricity bills with a fixed monthly charge plus a variable charge based on usage, or salesperson salaries with a fixed base salary plus a commission based on sales.

Here is a 📋List of different types of cost, that will help you to identify the ones that apply to your business.

So, think about which type of cost will your business likely incur, you can use the tab “Potential Expenses” in your Business Case 📒Template to list them under the corresponding categories. You can of course modify, delete and add cost according to your needs.

Next Step
7

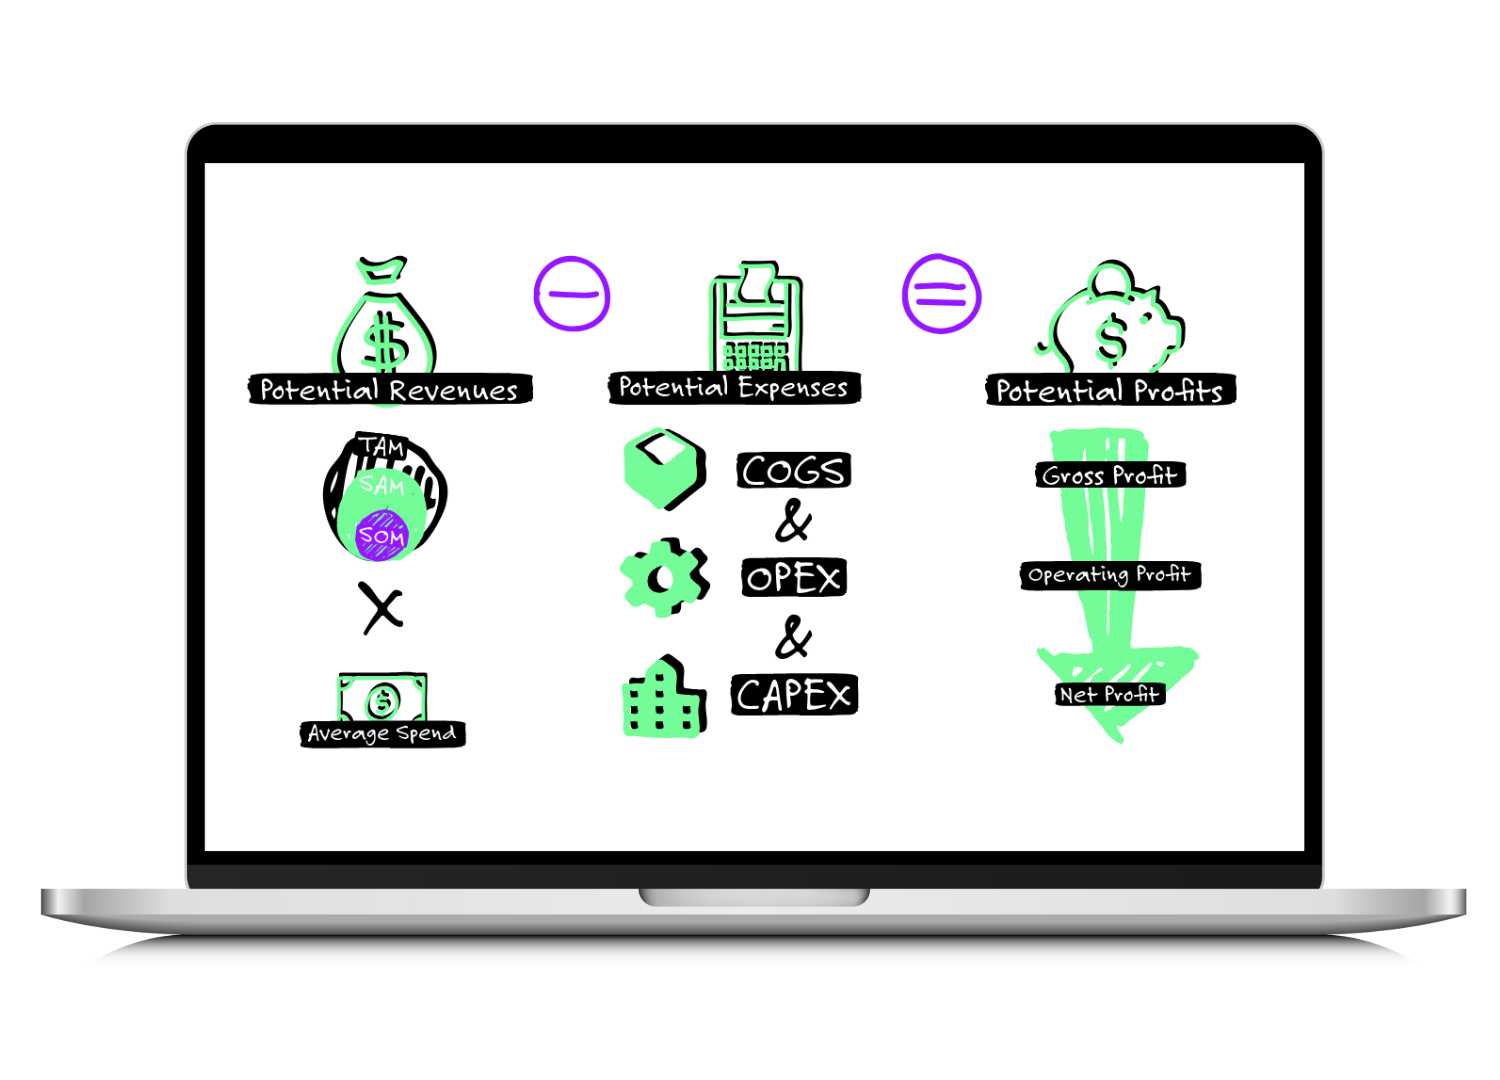
Step 7: Make your Expense Projections

What expenses your business will incur and how to calculate them of course heavily depends on the nature of your business, a D2C brand that sells physical goods will have very different expenses from businesses that sell SaaS. So it would be impossible to provide a generalized approach on how to project your expenses. However, we will give you some guidelines to consider for the most common expenses.

Your COGS could include:

  • Product Cost: Those are the expenses a business incurs when producing a good. They can include things like the raw material, supplies, packaging, labeling or if you hire a contract manufacturer to produce the goods for you, simply the cost of the finished product.

🧮To calculate these expenses a good starting point is the cost per unit, meaning how much it costs you to produce one unit of your product. You can then extrapolate this number by multiplying the unit cost with your expected sales volume (units). You also want to consider possible economies of scale, meaning that the unit cost will decrease the more units you produce.

 cost per unit x sales volume in units

  • Shipping & Fulfillment Cost: Those include for example the cost that incur for delivering your products to your customers. Of course those can also vary strongly depending on if you are delivering them directly to the home of your customers or if you are selling them through a wholesaler.

🧮However, to calculate them you could try to figure out how much “one” shipment costs and then multiply this cost by the number of shipments you will make. To estimate the number of shipments you will make divide the total sales volume (units) through the number of products your client purchases on average per order.

→ cost per shipment x number of orders (total sales volume/ average number of products per order)

  • Direct Labor Cost: The direct labor cost are the salaries or wages you pay to those employees who are directly involved in producing a product or delivering a service. When running a service business like a consulting business or an agency those costs will account for the major part of your COGS.

🧮To calculate these expenses multiply the average salary per year by the number of Full Time Equivalents (FTEs) or in other words full time employees that you are going to require. Take into account that the number of FTEs likely increases the more your business grows over the years. On the other hand, the average salary probably also increases a little due to inflation.

→ average salary x FTEs

Your OPEX could include: 

  • Marketing, Advertising and Sales Cost: An important expense that any business will incur are the cost of marketing, advertising and sales. Especially when a brand is new and still unknown you will have to invest in these positions to generate brand awareness and acquire your first customers.

🧮One way to estimate your marketing and sales expenses is to apply a percentage of your planned revenue. This percentage of course heavily depends again on the nature of your business. B2C businesses usually invest heavier in marketing than B2B businesses for example. However, in general, it is common for businesses to allocate between 5-15% of their total revenue to marketing and sales expenses.

→ total potential revenues x x%

  • Salaries & Wages: Those are the salaries and wages that you pay those employees who work in indirect positions, meaning jobs that are not directly related with the production of your goods or services like marketing, sales, finance etc.

🧮To estimate these expenses, define the job profiles you will need and research the average salaries for each profile.Then multiply the average salary per year by the number of Full Time Equivalents (FTEs) that you are going to require for each profile. Take into account that the number of FTEs likely increases the more your business grows over the years. On the other hand, the average salary probably also increases a little due to inflation.

→ average salary x FTEs

  • Rent & Utilities: This is what you pay for the use of a building or property like for example an office or warehouse space, while utilities include the cost of electricity, gas, water, and other essential services needed to run the business.

🧮To estimate your expenses you can start by researching the average rental and utility costs in the area where you plan to operate your business. Look at the historical trends and projections for the next 5 years. Estimate the amount of space you will need, and calculate the corresponding rental costs for that space. Based on the size and type of your business, estimate the amount of utilities you will need, and calculate the associated expenses for each type of utility. Take into account the inflation rate and any potential market trends that may impact rental and utility costs over the next 5 years.

  • Software Fees: Within your daily operations you will probably also use different software services for which you will have to pay monthly or annual fees.

🧮To estimate your spend on software fees, make a list with all the SaaS you are probably going to need. Go to their websites, check their prices, and calculate how much you will have to spend every year in fees.

  • Website Hosting & MaintenanceAny business nowadays will usually have a website or an online shop even if it is a very simple one, so usually any business will incur some type of cost for website hosting and maintenance.

🧮To get an idea about your website expenses, go and check the plans offered by the different hosting providers, you probably already chose on to build your MVP. Use those prices to calculate your annual spend. Also take into consideration that usually the prices for website hosting are tied to the website traffic, so with increasing website traffic you will probably also have increasing website cost for a higher plan.

  • Professional Fees: Those are expenses that a business incurs for the services of professionals such as lawyers, accountants, consultants, and other experts. These fees may be one-time or ongoing, depending on the nature of the services provided.

🧮To estimate these expenses you can start by researching industry standards for professional fees in your particular sector. Some factors that may influence professional fees include the size and complexity of your business, the level of expertise required, and the nature of the services provided. It’s important to consider potential changes in your business over time.. Some fees may be incurred early on in your business’s life, while others may be ongoing or increase as your business grows.

Your CAPEX could include different types of assets such as equipment, machinery and so on. The price you paid for those assets is not directly considered an expense in your P&L. What is considered an expense is the annual depreciation or amortization (D&A) meaning the decrease in value of the asset over time.

While depreciation is used for tangible assets such as machinery, buildings, and vehicles. It represents the decrease in value of the asset over time due to wear and tear, obsolescence, or other factors.

Amortization, on the other hand, is used for intangible assets such as patents, copyrights, and trademarks. It represents the process of spreading out the cost of the intangible asset over its useful life.

There are several methods for calculating the depreciation of an asset, but one of the most common methods is the straight-line depreciation method. So to estimate the D&A of your assets you can:

  • Determine the cost of the asset, including the purchase price, delivery and installation costs, and any other costs associated with getting the asset ready for use.
  • Determine the estimated useful life of the asset, meaning the length of time the asset is expected to be in use. The useful life can be estimated based on factors such as the asset’s expected wear and tear, technological advances, and changes in demand for the asset.
  • Subtract the estimated salvage value from the cost of the asset, the salvage value is the estimated value of the asset at the end of its useful life. This is the amount that the company expects to receive if it sells the asset at the end of its useful life.
  • Divide the resulting value by the estimated useful life (in years), this gives you the amount of depreciation that should be deducted each year.

Now go ahead and try to estimate the value of the different cost you listen in the tab “Potential Expenses” in your Business Case 📒Template.

Next Step
8

Step 8: Calculate your Profitability

Finally, with the estimation of your potential revenues and expenses, you can make a forecast for your potential profits.

We have provided a very simplified P&L (Profit and Loss Statement) in you Business Case  📒Template, it  should automatically calculate your profits  once you introduced the revenues and cost correctly.

Here is however, a short explanation of the different profit positions, so you can also make the calculations on your own.

  • Revenues: This is the total amount of money a company earns from selling its products or services. It is also referred to as the “top line” because it is the first item listed on the P&L statement.
  • Gross Profit (EBITDA): This is the amount of money a company makes after deducting the direct costs associated with producing and selling its products or services. It is calculated by subtracting the cost of goods sold (COGS) from the total revenue.
  • Operating Profit (EBIT): This is the amount of money a company makes after deducting its operating expenses from its gross profit and before deducting interest and taxes. EBIT is a good measure of a company’s operating profitability because it focuses solely on the company’s core operations and ignores the effects of financing and taxes.
  • Net Profit: This is the amount of money a company makes after deducting all of its expenses, including taxes, from its EBIT. Net profit is also sometimes referred to as the “bottom line” because it is the last item listed on the P&L statement.

With this you should get a first idea about the financial viability of your business. Remember that you can keep adjusting your business case, based on the new insights and data you gather for example through your validation experiments.

Conclusion

In conclusion, building a business case is not just a formality; it’s a strategic imperative for businesses seeking growth and sustainability. By meticulously analyzing revenue potential, estimating expenses, and considering various scenarios, you can mitigate risks, seize opportunities, and position your business for long-term success. Embrace the business case as a powerful tool for financial planning and strategic decision-making, empowering you to realize the full potential of your business idea in today’s competitive marketplace.

Sign up for our newsletter and become the navigator of tomorrow's trends. Equip your strategy with unparalleled insights!