In the ever-evolving landscape of mobile applications, one significant aspect constantly on the minds of app developers, marketers, and stakeholders is app monetization. Creating an exceptional app is just the first step towards achieving sustainable revenue generation. To truly succeed in the industry, it is imperative to understand and optimize critical app monetization metrics.
In this insightful blog post, we will delve into the world of app monetization, its importance, and the key metrics to monitor in order to maximize return on investment. By comprehending these vital parameters, you will be empowered to craft effective strategies and pave the way for your app’s ultimate success in today’s hyper-competitive market.
App Monetization Metrics You Should Know
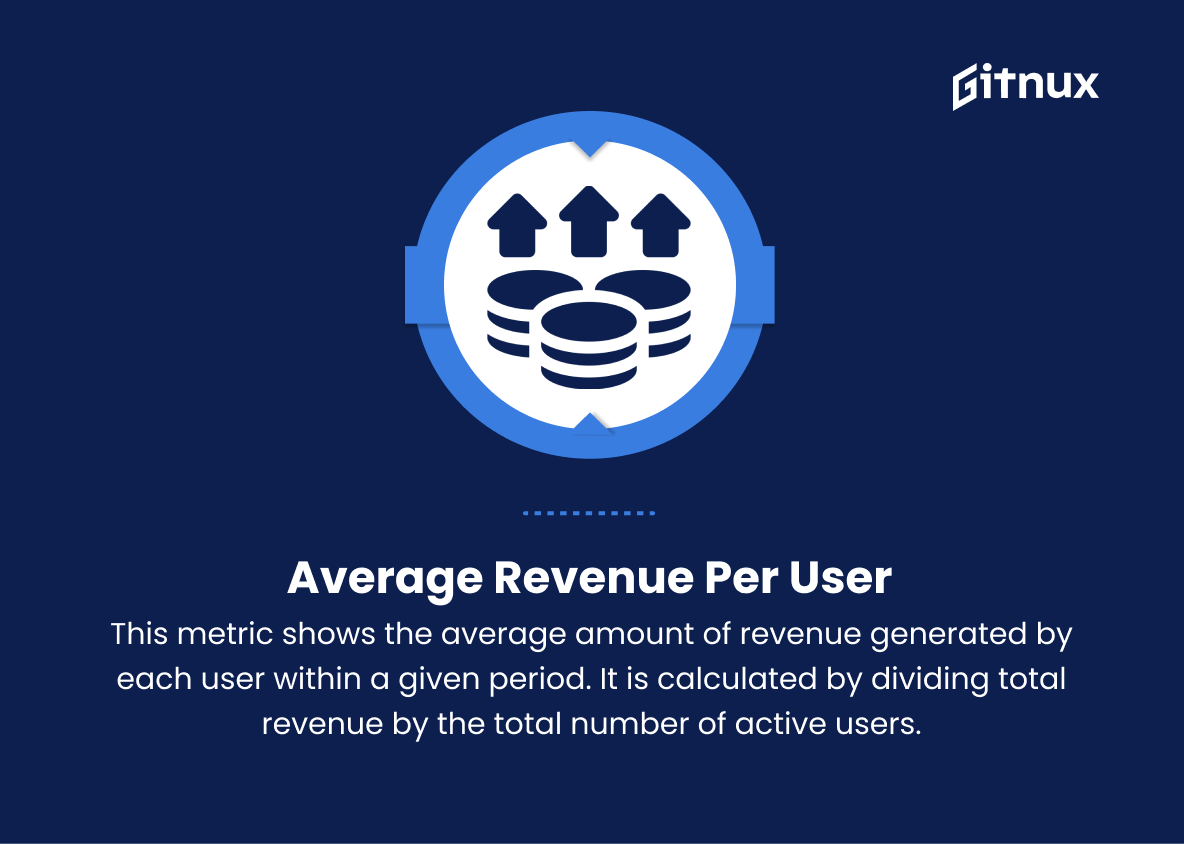
1. Average Revenue Per User (ARPU)
This metric shows the average amount of revenue generated by each user within a given period. It is calculated by dividing total revenue by the total number of active users.
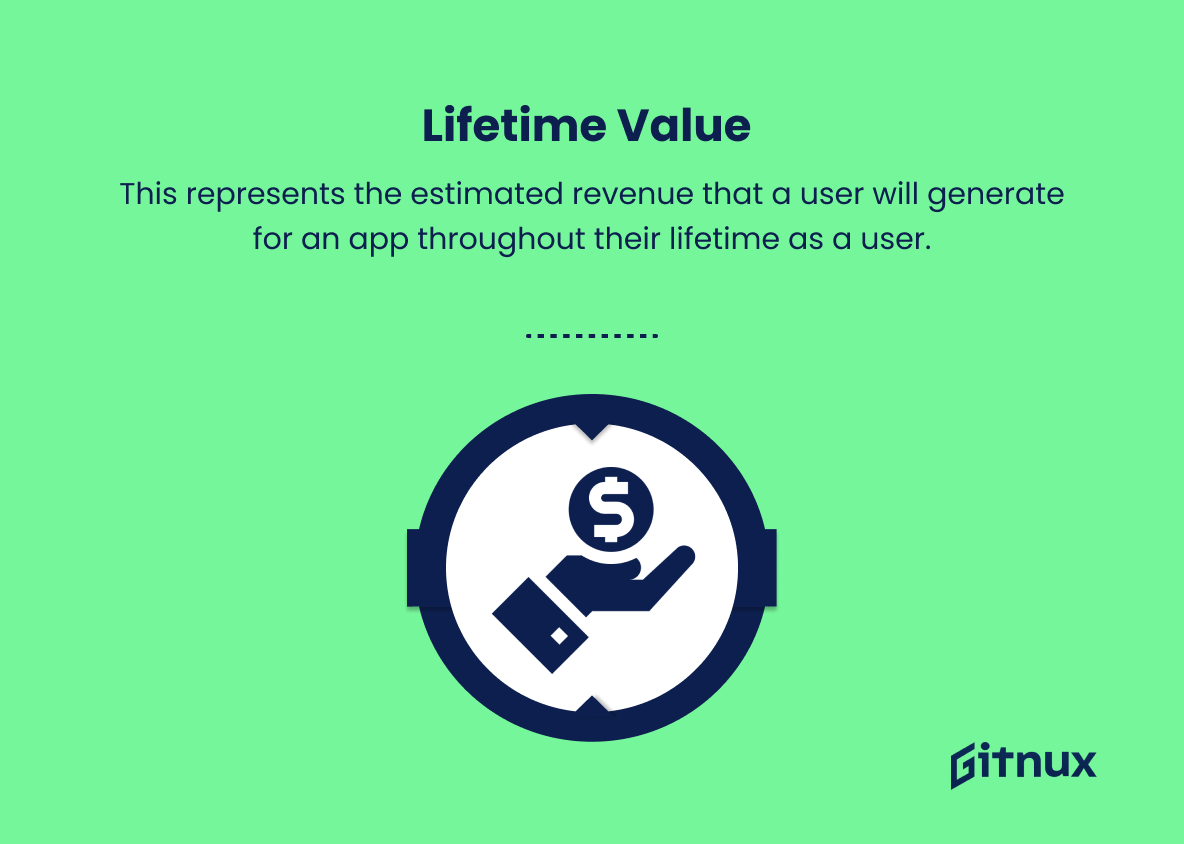
2. Lifetime Value (LTV)
This represents the estimated revenue that a user will generate for an app throughout their lifetime as a user. LTV helps to determine the maximum cost of acquiring a new user and guides marketing strategies.
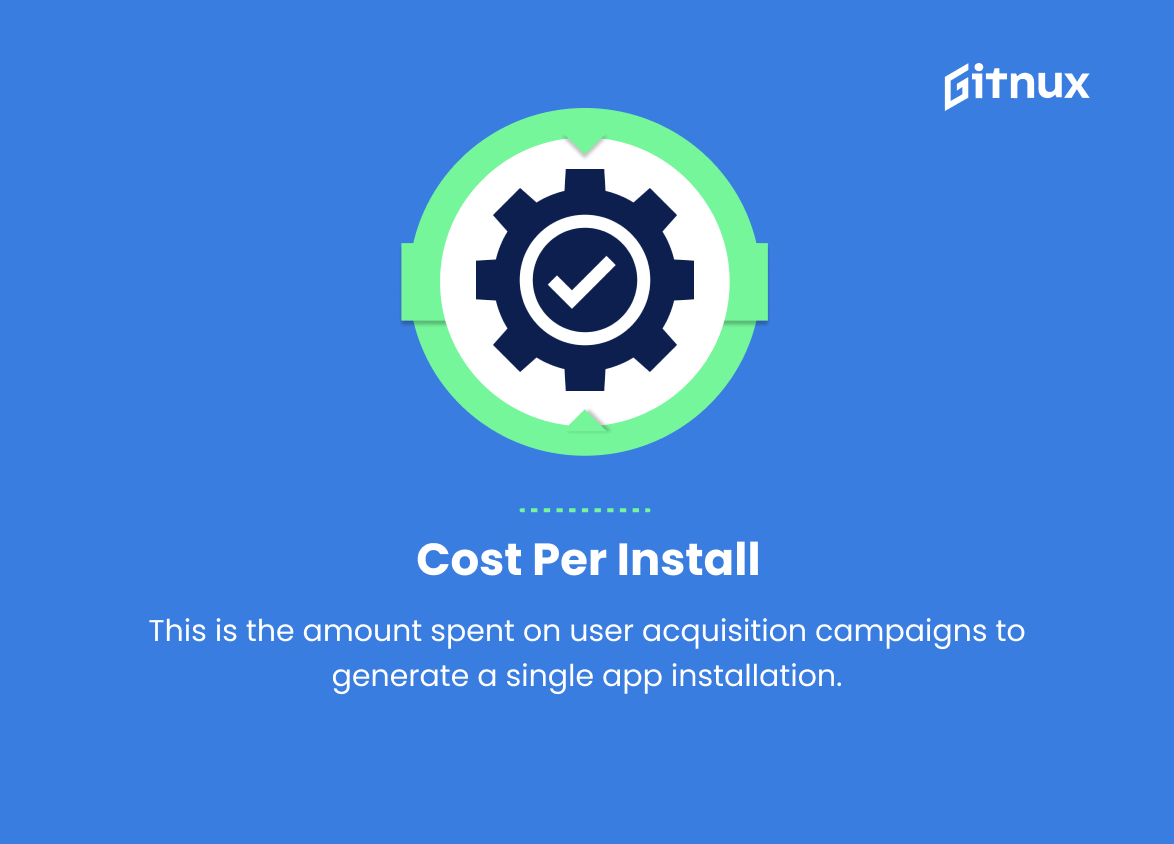
3. Cost Per Install (CPI)
This is the amount spent on user acquisition campaigns to generate a single app installation. It helps to understand the effectiveness of marketing efforts on driving app installations.
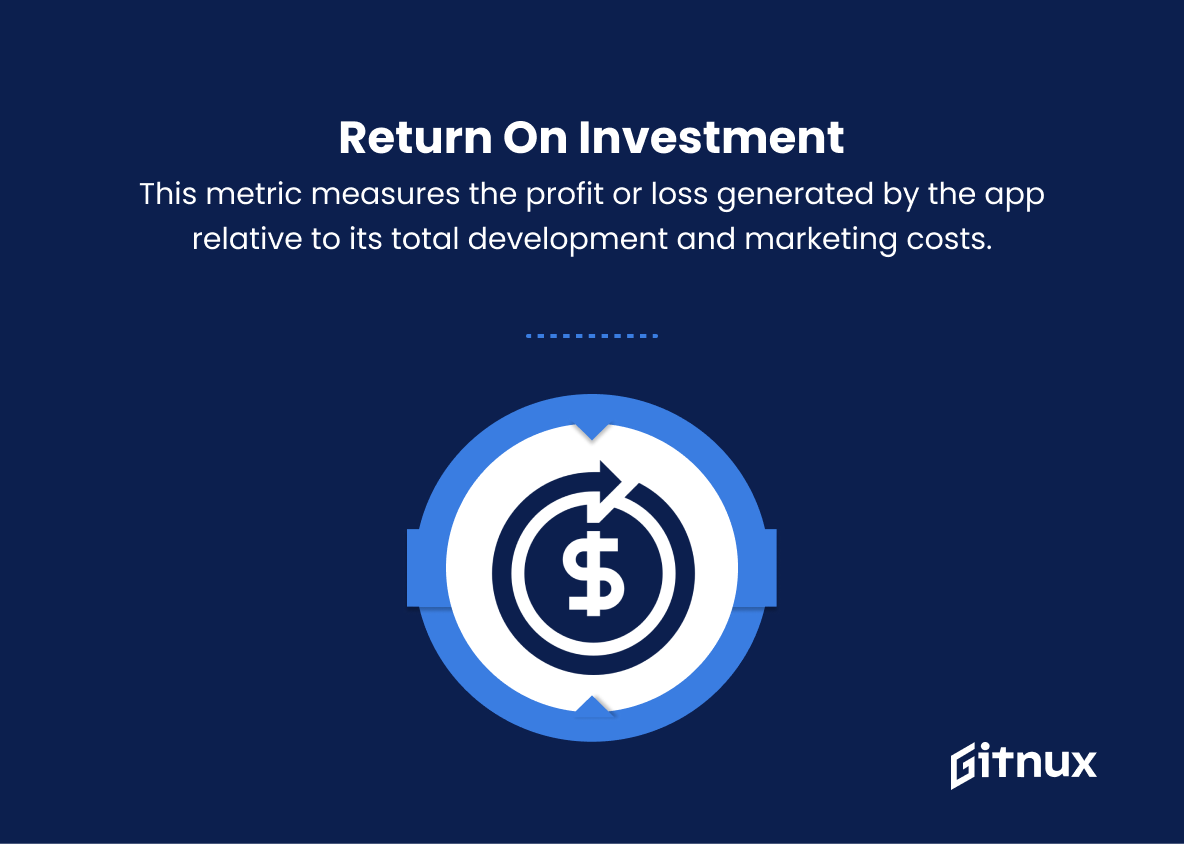
4. Return on Investment (ROI)
This metric measures the profit or loss generated by the app relative to its total development and marketing costs. A positive ROI indicates that the app is generating more revenue than it costs to create and maintain.
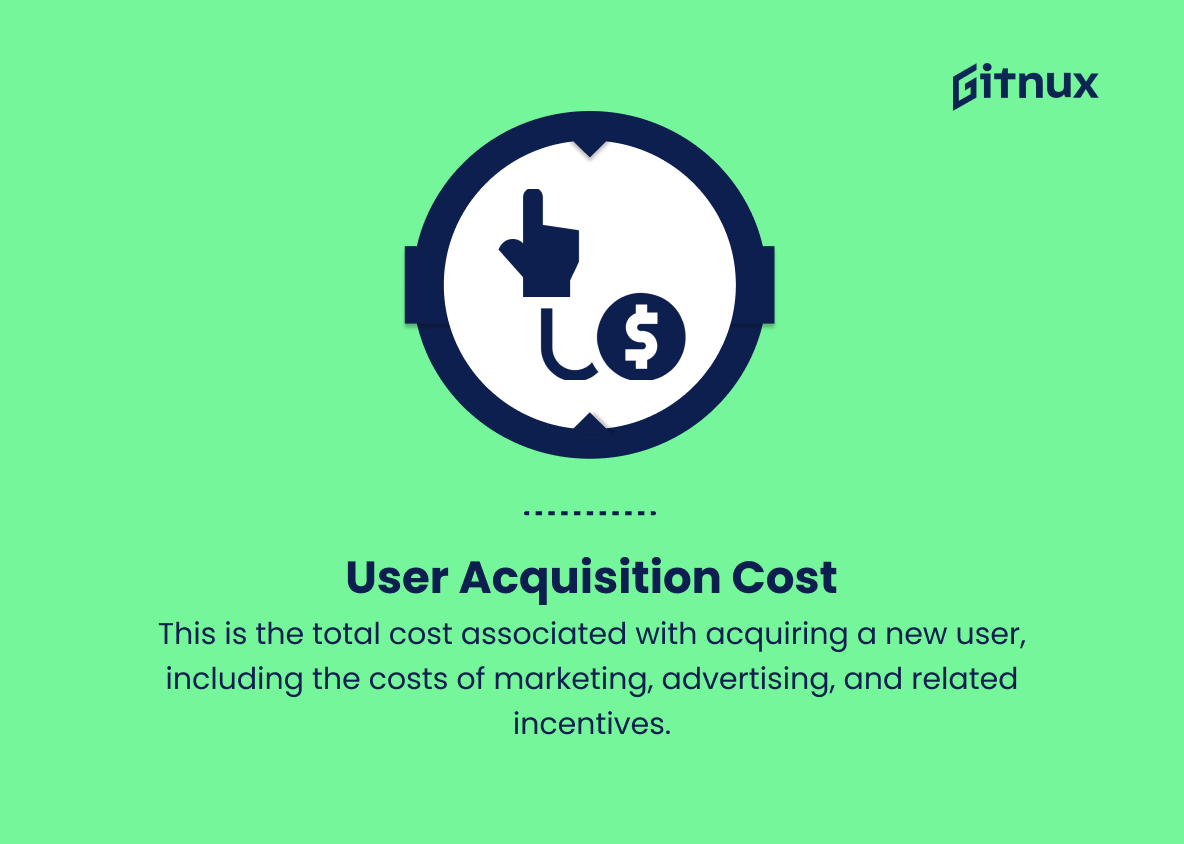
5. User Acquisition Cost (UAC)
This is the total cost associated with acquiring a new user, including the costs of marketing, advertising, and related incentives. Lowering this cost is crucial for improved app profitability.
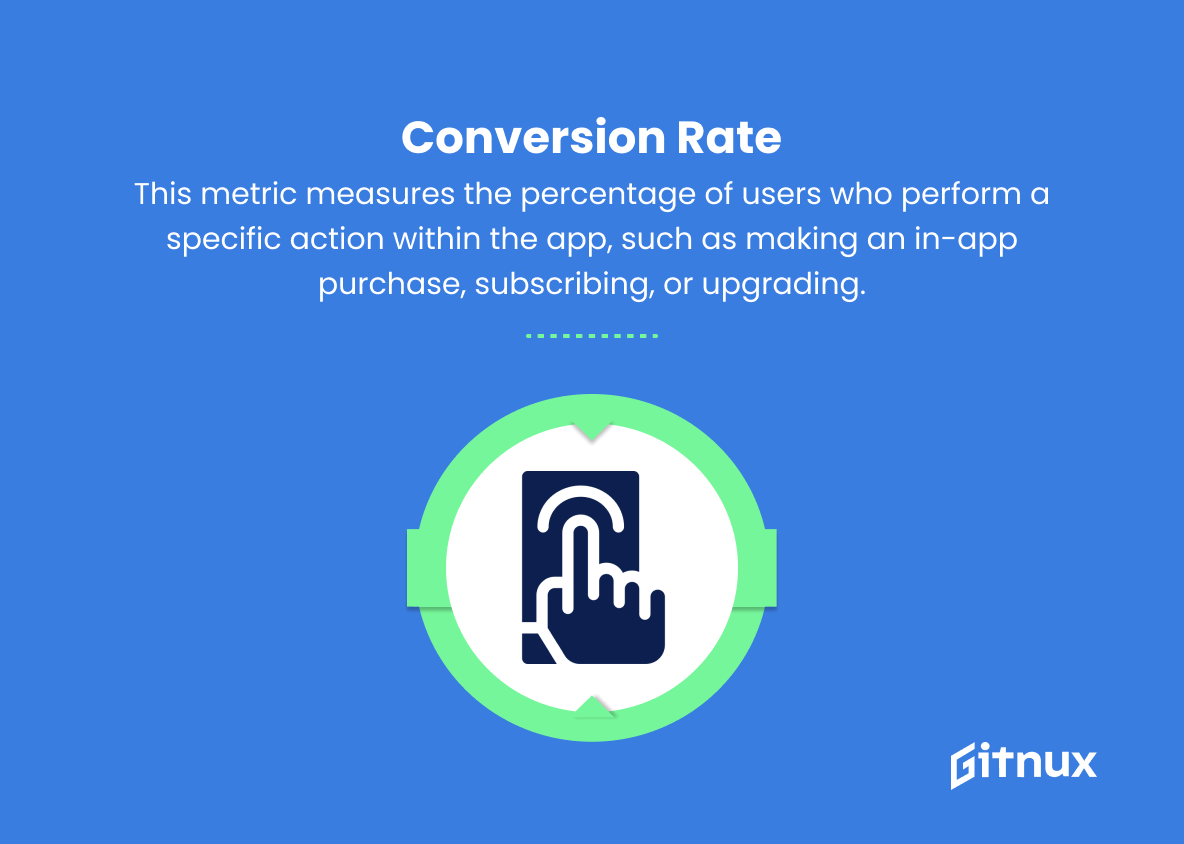
6. Conversion Rate (CR)
This metric measures the percentage of users who perform a specific action within the app, such as making an in-app purchase, subscribing, or upgrading. It helps to evaluate the effectiveness of user engagement and monetization strategies.
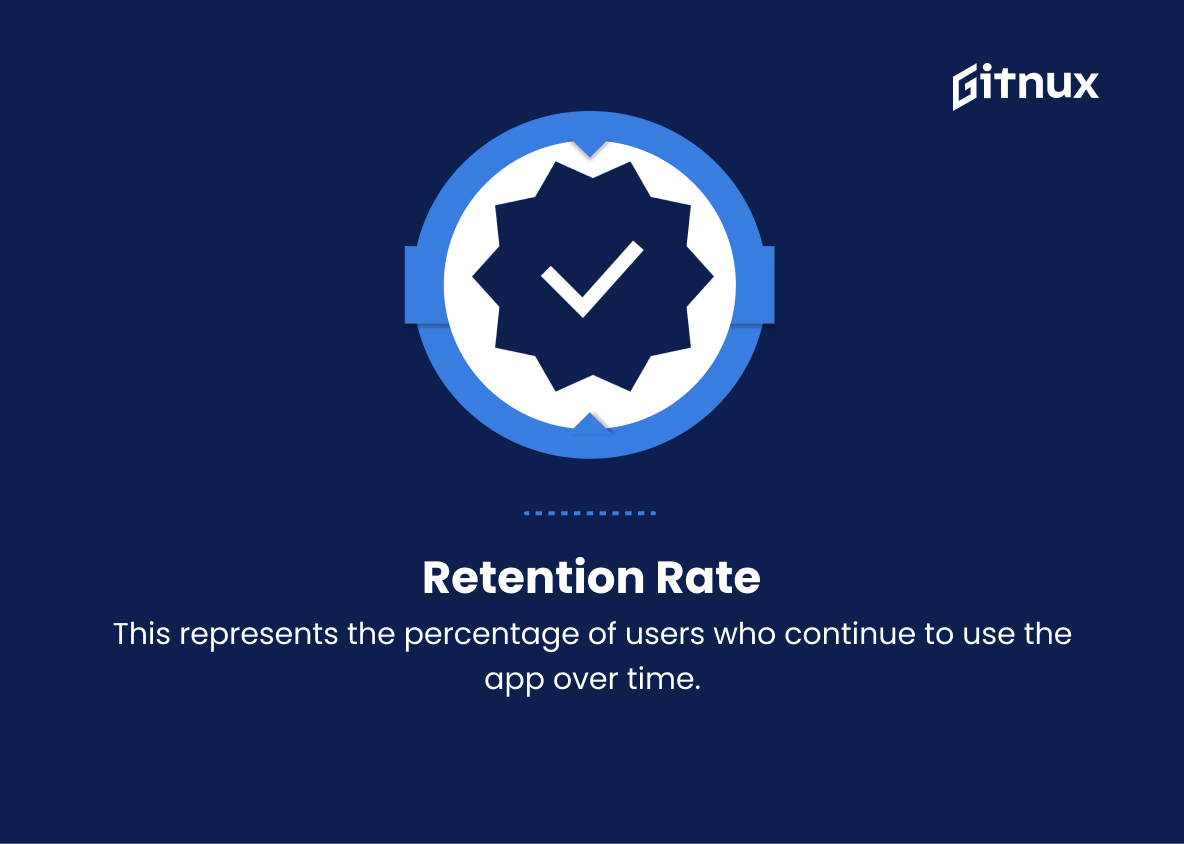
7. Retention Rate
This represents the percentage of users who continue to use the app over time. Higher retention rates indicate a higher level of user satisfaction and are key to long-term profitability.
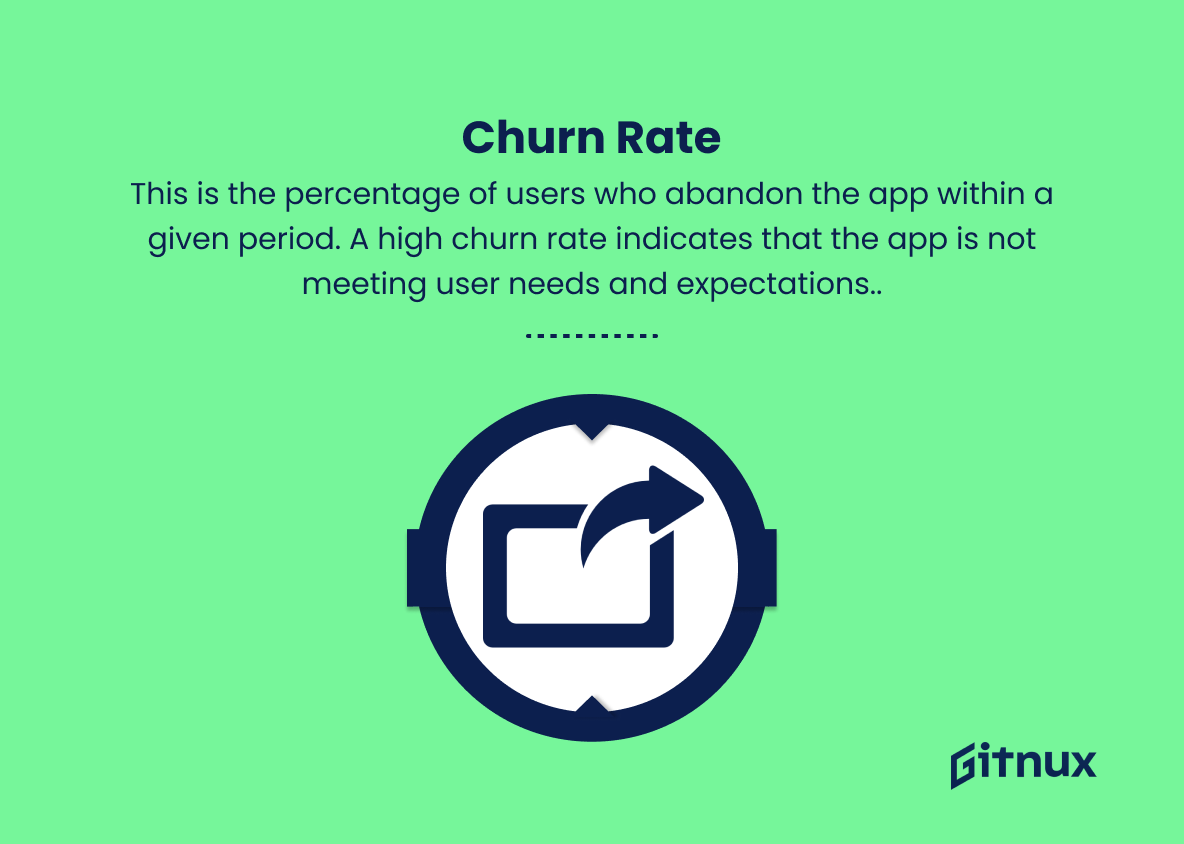
8. Churn Rate
This is the percentage of users who abandon the app within a given period. A high churn rate indicates that the app is not meeting user needs and expectations.
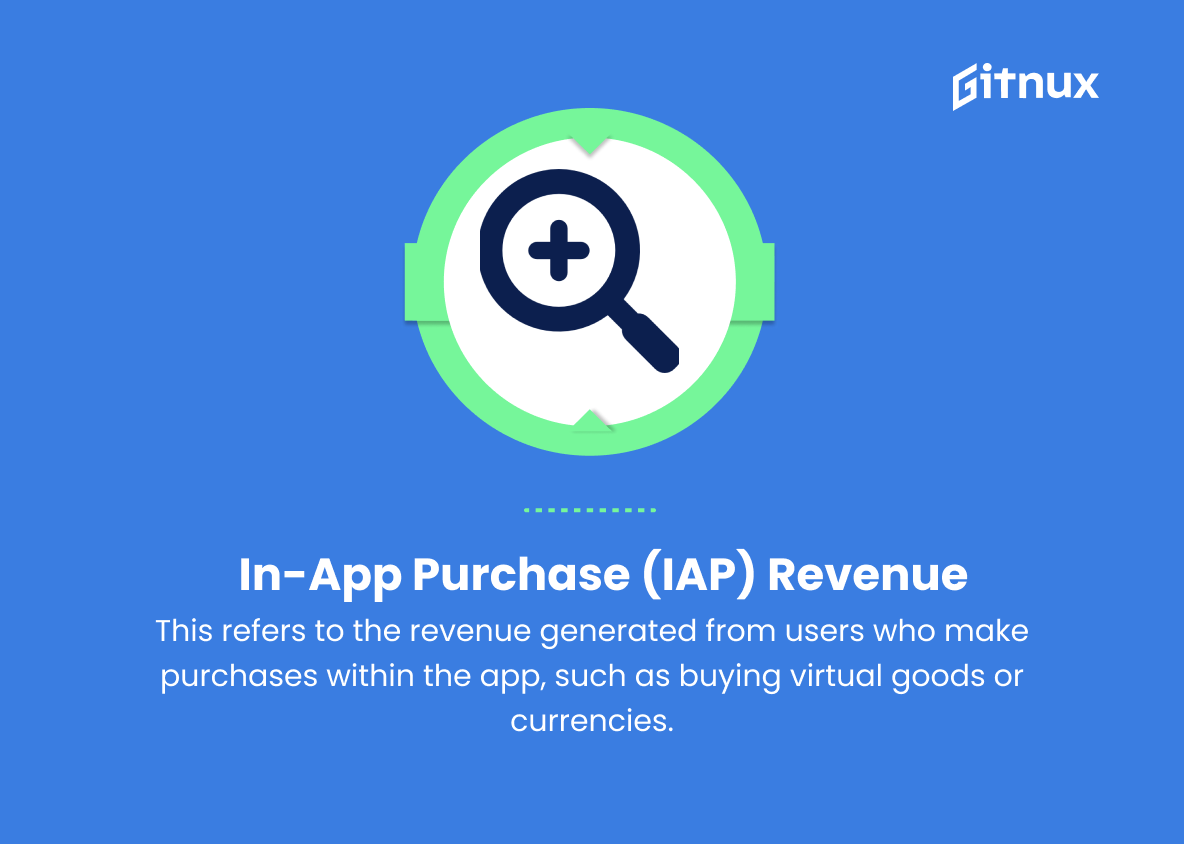
9. In-App Purchase (IAP) Revenue
This refers to the revenue generated from users who make purchases within the app, such as buying virtual goods or currencies. It is a critical indicator of the app’s monetization performance.
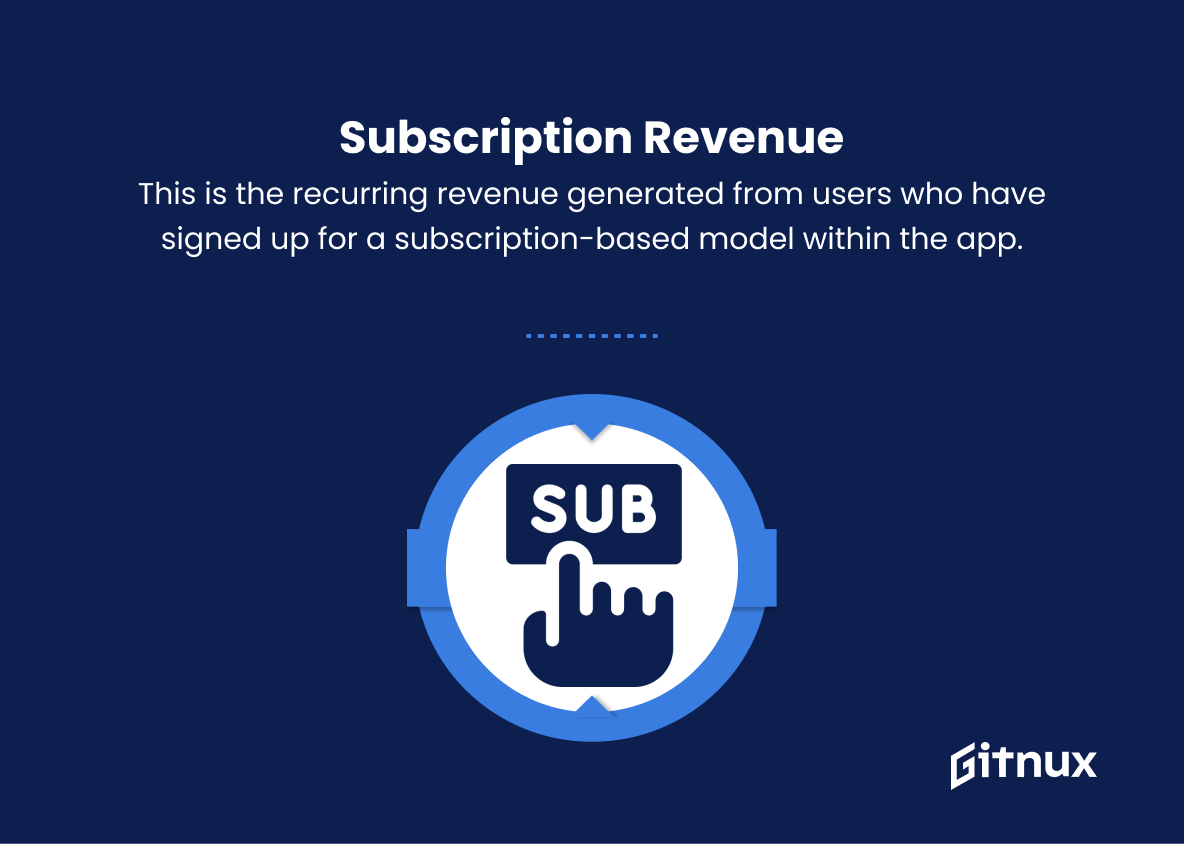
10. Subscription Revenue
This is the recurring revenue generated from users who have signed up for a subscription-based model within the app. Subscription revenue can provide a stable and predictable revenue stream.
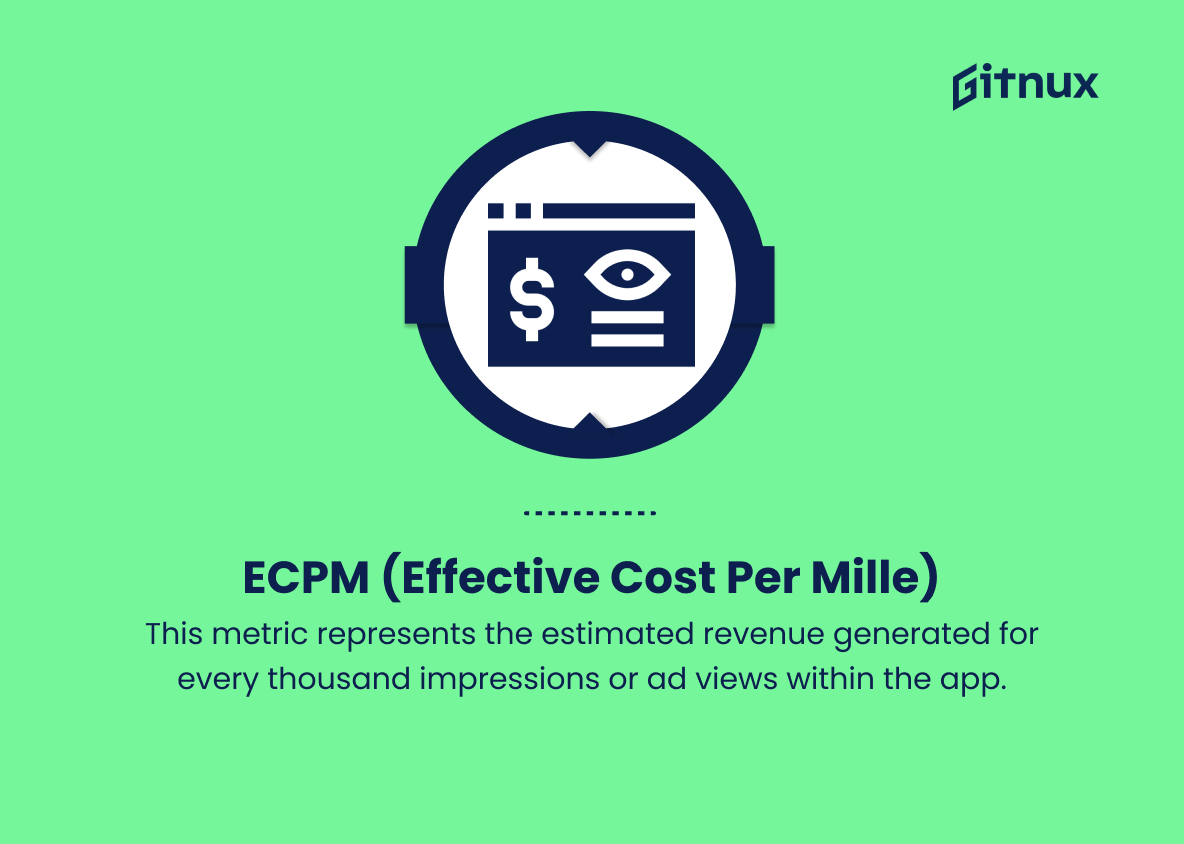
11. eCPM (effective cost per mille)
This metric represents the estimated revenue generated for every thousand impressions or ad views within the app. A higher eCPM indicates that the ads shown in the app have higher value engagements with the users.
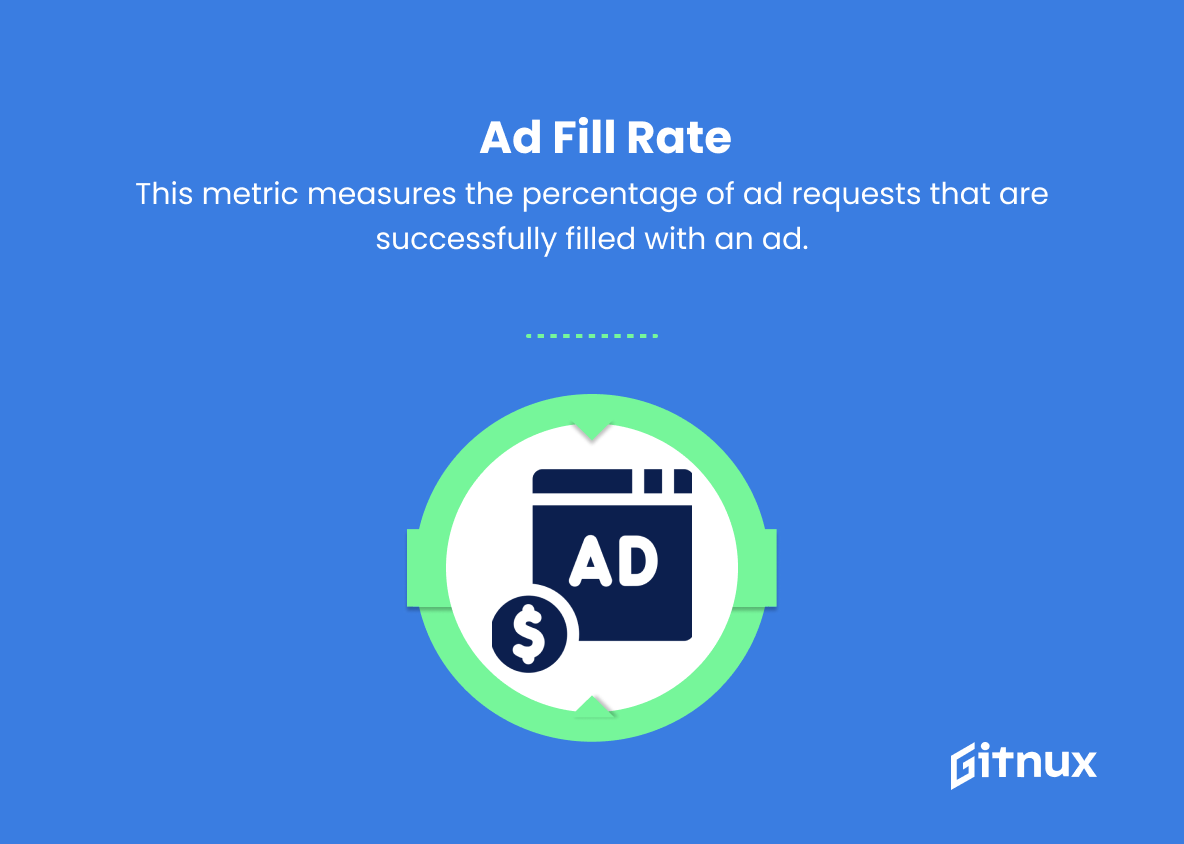
12. Ad Fill Rate
This metric measures the percentage of ad requests that are successfully filled with an ad. Low fill rates may mean that there is unmet demand for ad inventory, which can cause a loss of potential ad revenue.
13. Ad Click-Through Rate (CTR)
This represents the percentage of users who click on an ad after viewing it. Higher CTRs indicate more engaging and effective ads, leading to higher ad revenue.
App Monetization Metrics Explained
App Monetization Metrics are crucial for measuring the financial success and growth of an app. Metrics such as Average Revenue Per User (ARPU), Lifetime Value (LTV), and Cost Per Install (CPI) allow app developers and marketers to gauge user behavior, the effectiveness of their marketing campaigns, and the revenue generated by individual users. In addition, measuring Return on Investment (ROI), User Acquisition Cost (UAC), and Conversion Rate (CR) provide insights into the app’s profitability, optimal user acquisition strategies, and the impact of engagement efforts on monetization.
Retention Rate and Churn Rate metrics serve as indicators of user satisfaction and potential areas for improvement, while In-App Purchase (IAP) Revenue and Subscription Revenue reflect the success of the app’s monetization models. Finally, eCPM, Ad Fill Rate, and Ad Click-Through Rate (CTR) assess the performance and engagement of in-app advertisements, which are key contributors to overall app revenue. Understanding and optimizing these metrics ensures a more profitable and sustainable app ecosystem for developers and marketers alike.
Conclusion
In conclusion, app monetization metrics are a vital aspect for app developers and businesses to gauge the financial success and growth potential of their applications. This entails a deep understanding of the various metrics such as eCPM, ARPDAU, LTV, and user acquisition costs to make informed decisions that positively impact revenue streams.
By regularly monitoring and analyzing these metrics, developers can adapt their strategies, optimize their advertising and in-app purchases, and drive sustainable growth. Ultimately, the key to successful app monetization lies in striking the right balance between offering an exceptional user experience and capitalizing on monetization opportunities. Stay ahead in the competitive app market by integrating this valuable data into your decision-making process and watch your application thrive.
